January 10, 2015
Tableau Tip: One Parameter; Unlimited Number Formats
calculated field
,
Joe Mako
,
labels
,
number format
,
parameter
,
tableau
,
tips
,
tricks
13 comments
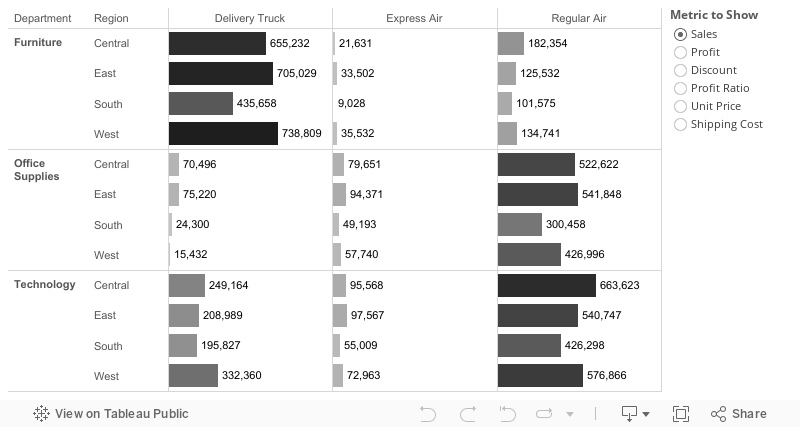
As a follow up to yesterday's blog post about "One Metric; Two Number Formats", Tableau Zen Master Joe Mako left a suggestion that I'm going to write about today that utilizes the Labels shelf. This method allows you to have as many different number formats as you desire, whereas my previous post only allowed two (and frankly, its use case it pretty limited).
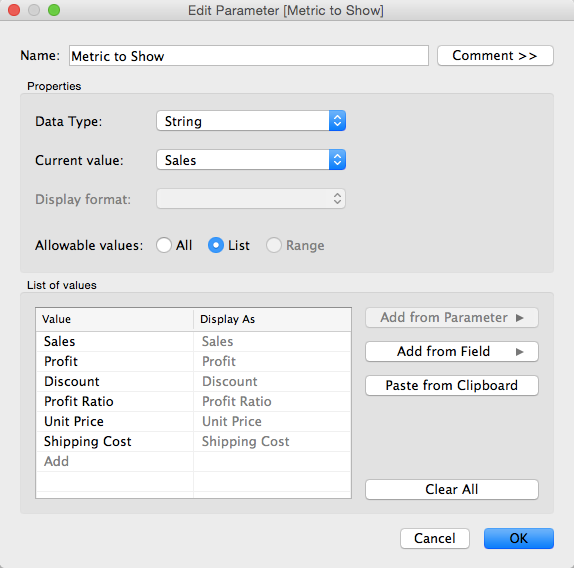
Step 1: Create a parameter that is a list of metrics.
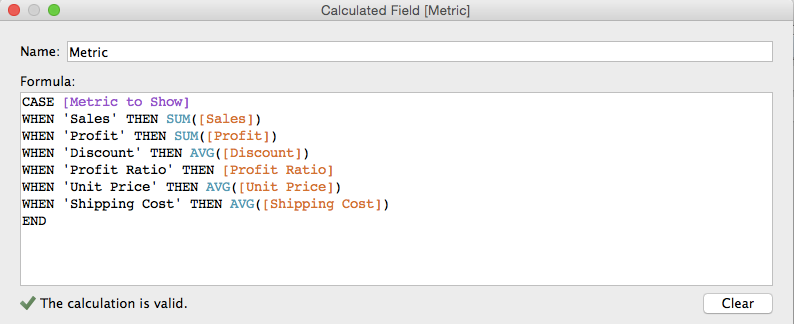
Step 2: Create a calculated field that returns the value of the metric selected.
Step 3: Create a series of calculated fields, one for each of the possible selections in the parameter. Here are a few of them:
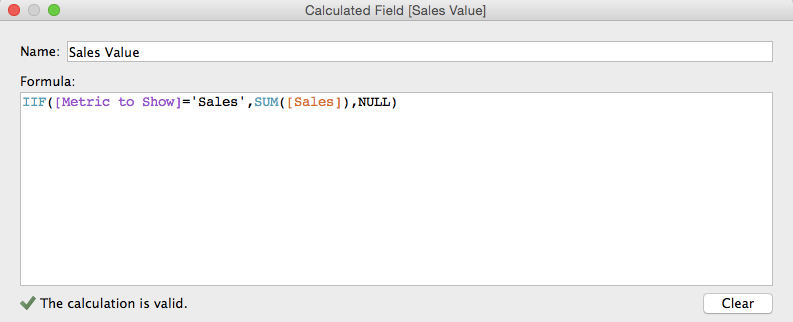
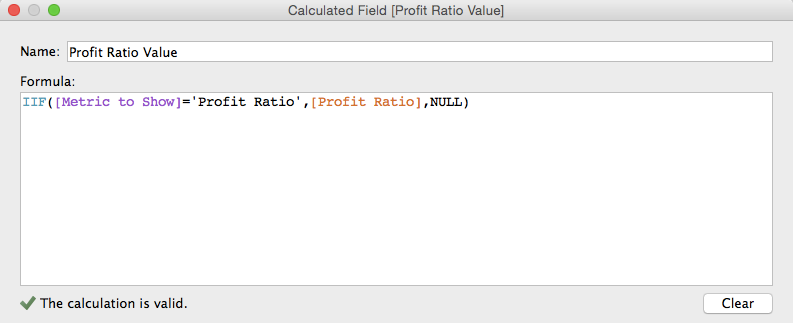
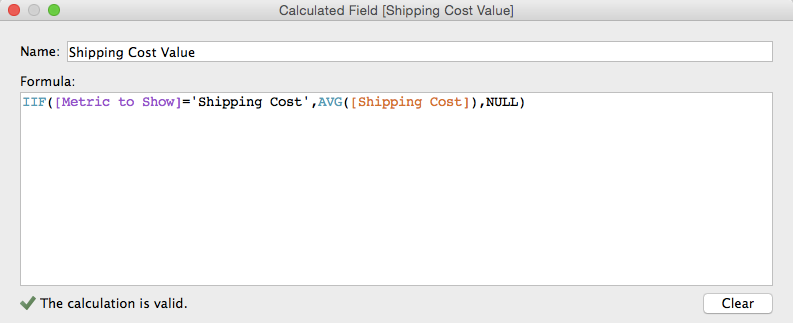
Notice how each of these calculated fields returns NULL if they are not selected; that's important to make the final display work properly.
Step 4: Change the default number format for each of the fields created in Step 3 to the appropriate format.
Step 5: Start building the view by adding dimensions to the Row and Column shelves and add the Metric created in Step 2 to the Columns shelf.
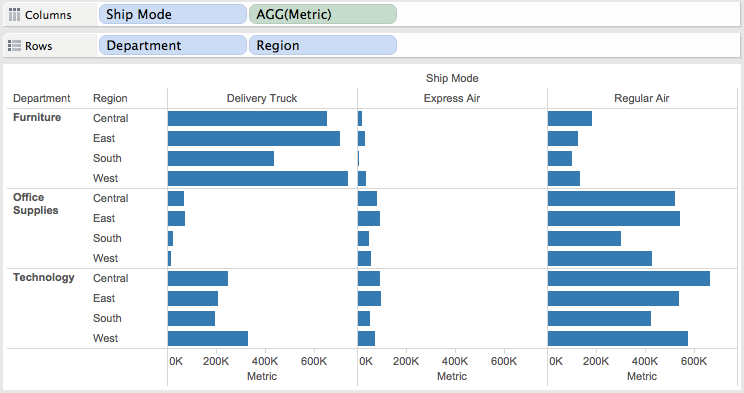
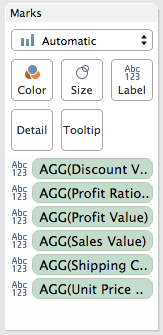
Step 6: Drag all of the calculated fields created in Step 3 to the labels shelf.
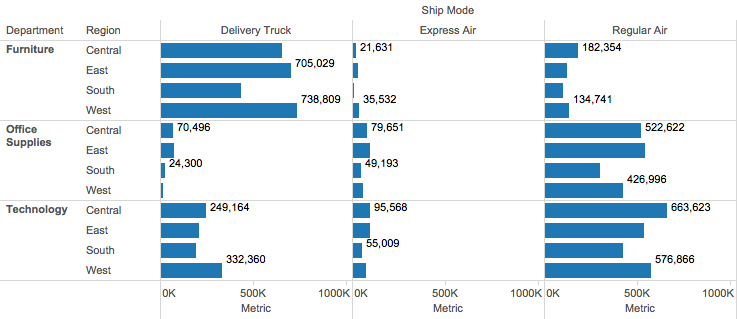
The view now looks like this. Notice how the labels aren't quite aligned with the bars.
Step 7: Show the Parameter control.
Step 8: Click on the Labels shelf, then click on the button with the three dots next to the Text box.
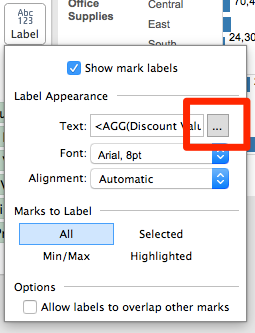
That will display the Edit Label dialog box.
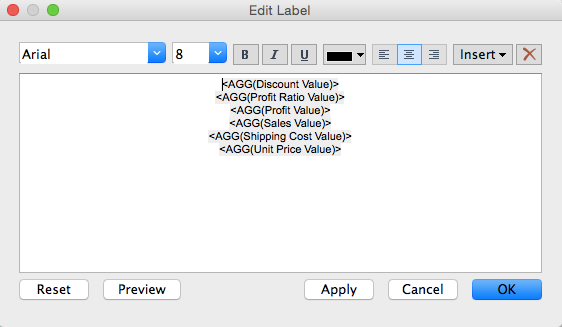
The metrics are not aligned with the bars in Step 6 above because each metric is on its own line.
Step 9: Remove all of the line returns between in the Edit Label box.
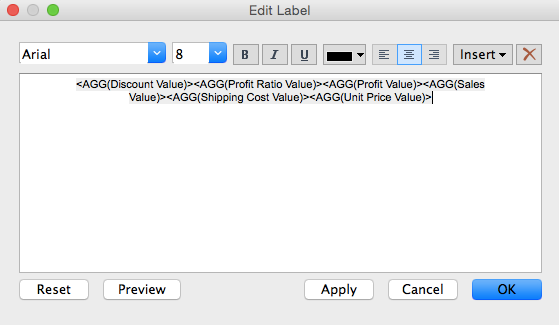
Now the text properly aligns with the bars. Try picking a different metric from the parameter and the text will stay aligned.
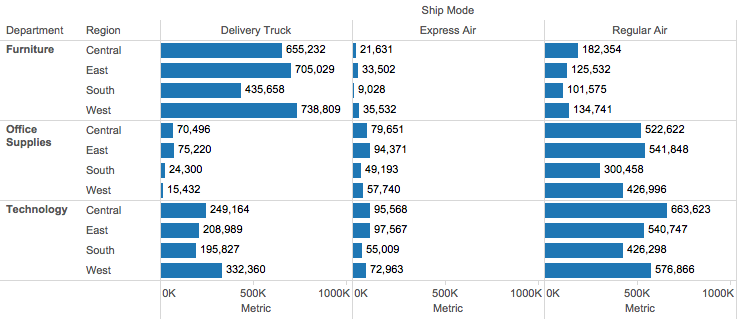
Step 10: Clean up the view a bit by hiding the header to the Metric field and adding Metric to the Color shelf.
You can download the workbook used to create this blog post here.
Step 1: Create a parameter that is a list of metrics.
Step 2: Create a calculated field that returns the value of the metric selected.
Step 3: Create a series of calculated fields, one for each of the possible selections in the parameter. Here are a few of them:
Notice how each of these calculated fields returns NULL if they are not selected; that's important to make the final display work properly.
Step 4: Change the default number format for each of the fields created in Step 3 to the appropriate format.
Step 5: Start building the view by adding dimensions to the Row and Column shelves and add the Metric created in Step 2 to the Columns shelf.
Step 6: Drag all of the calculated fields created in Step 3 to the labels shelf.
The view now looks like this. Notice how the labels aren't quite aligned with the bars.
Step 7: Show the Parameter control.
Step 8: Click on the Labels shelf, then click on the button with the three dots next to the Text box.
That will display the Edit Label dialog box.
The metrics are not aligned with the bars in Step 6 above because each metric is on its own line.
Step 9: Remove all of the line returns between in the Edit Label box.
Now the text properly aligns with the bars. Try picking a different metric from the parameter and the text will stay aligned.
Step 10: Clean up the view a bit by hiding the header to the Metric field and adding Metric to the Color shelf.
You can download the workbook used to create this blog post here.
Subscribe to:
Post Comments
(
Atom
)


Will this work for all type of charts, or is it specific to bar charts?
ReplyDeleteThis method uses the labels shelf, so it will work with any chart type.
DeleteAny way to replicate this using dimensions in a row shelf header?
DeleteE.g. I've got a parameter setup to switch dates based on custom date calculations and case statements (similar to what you've done here, but custom dates based on a parameter rather than metrics based on a parameter.) I would love for "Quarter" custom dates to be formatted QQQ-YY and for "Week" custom dates to format as XX-XX-XX, etc. It seems I'm only able to apply a format to the final dimension included in the view.
Any thoughts?
How about something like this? http://vizwiz.blogspot.co.uk/2014/11/conditional-axis-formatting.html
DeleteGENIUS!
ReplyDeleteWill this method also work on reference line labels?
ReplyDeleteI highly doubt it since reference lines can only have 1 format but that's not to say you couldn't work around it with multiple reference lines that will go to null if that option isn't selected. Give it shot!
DeleteKim, I've confirmed you can do this via reference lines by creating multiple ref lines and having them go to null if they aren't selected from the parameter. I'll create a video for this. In the meantime, you can find the workbook here - http://1drv.ms/1XGKAM3
DeleteAwesome! Thanks so much for sharing!!
ReplyDeleteJust created the video blog post for you.
Delete#TableauTip: How to Create Reference Lines with Multiple Number Formats http://vizwiz.blogspot.com/2015/12/multi-format-ref-lines.html
Awesome! Thanks so much for sharing, this help me a lot.
ReplyDeleteI've used this several times, and it's one of those small things that makes the views a lot better.
ReplyDeleteOn a current project I'm working on, I'm coloring states on a hex map, giving the users two different options: Color by Numeric change over time, or percentage change over time. The labels work great, but the legend still shows everything as numbers (23,456 is great, but -0.13 for percent is not.) Anyway to get it to work on legends?
Even if not, thanks again for your work on things like this. It's an enormous help.
Jon, create two separate calculations: one that returns the numeric change and one that returns the % change. They should return null when not picked. Set the default format for each field. Then place them both on the label shelf. Click on the label shelf and make sure they are on the same line. Then you should be good to go.
Delete