March 11, 2024
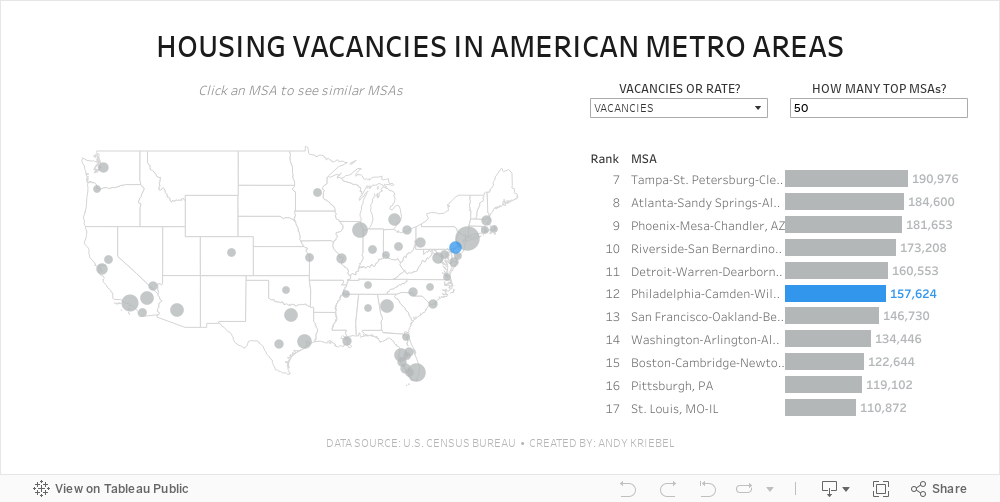
#MakeoverMonday 2024 Week 11 - Housing Vacancies in America
bar chart
,
filter
,
housing
,
how to
,
interactive
,
Makeover Monday
,
map
,
MSA
,
rank
,
set action
,
table calc
,
tableau
,
vacancy
,
window_max
No comments

Want to give it a try? Get the data here.
Requirements:
- Size - 1000x475
- Max 4 containers; no tiled containers allowed
- Filter out Alaska, Hawaii and Puerto Rico
- Clicking on a MSA in the map highlights the MSA in the map and bar chart and changes the MSAs that are displayed in the bar chart
- The bar chart shows the rank of the MSA for the metric selected.
- There should always be 11 bars (though I didn't test the lowest rank).
- The label on the end of the bar and in the map reflect the formatting of the measure selected (i.e., either whole numbers or a percentage to one decimaal).
- Include an option to change the measure and to change the number of MSAs on the map.
- Create a mobile view
- NO LODS!
Have fun!
Subscribe to:
Post Comments
(
Atom
)


No comments
Post a Comment