April 27, 2015
Makeover Monday: Where Is the Global Talent Pool Expected to Come from in 2030?

The global talent pool has never been larger, will grow to 2030, read http://t.co/aA9AyLEXta (pdf) #education #stats pic.twitter.com/aiIiTDbZt9
— OECD (@OECD) April 24, 2015
These pie charts are part of a larger study conducted by OECD, which you can read here. Some thoughts about these pie charts:
- The author is trying to show the change from 2013 to 2030. Using two pie charts makes this more difficult than necessary. At least, though, they kept the countries in the same order.
- The pies do not add up to 100%, I assume due to rounding. The 2013 pie adds up to 101% and the 2030 pie adds up to 102%.
- The focus is on the top 20 countries, so the “Other” category isn’t needed.
- The labels on the pies include both the country name and the value. A table would be better than this. Adding all of these labels makes the chart way too busy.
- There are two key metrics in the data: share of degrees and the number of degrees. The pie chart doesn’t provide enough context for understanding where the number of degrees will be coming from.
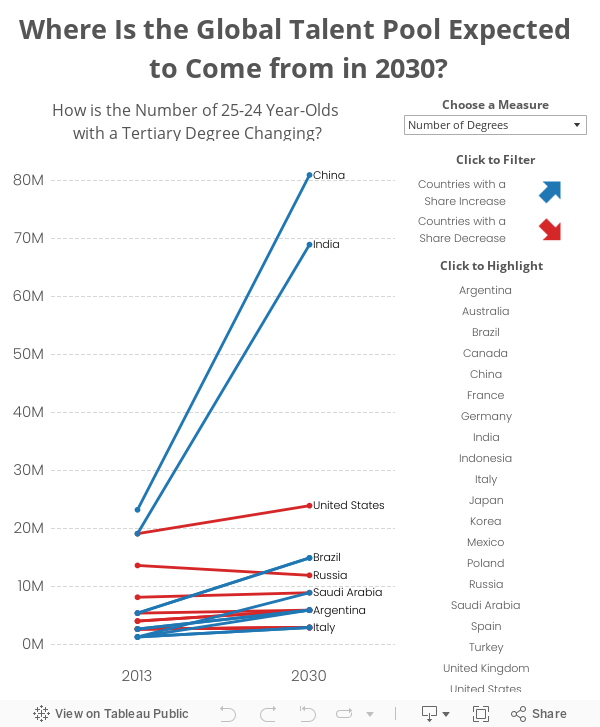
Given all of the above, I decided to create a slope graph.
- I included a parameter which allows you to select the metric.
- This option, along with using a slope graph, really helps show how dramatic the change is for China and India.
- Switch back and forth between the parameter options and you’ll see quite a different story.
January 29, 2013
Alberto Cairo: Three steps to become a visualization/infographics designer (a Tableau version)
Two weeks ago, we had the huge honor of hosting Alberto Cairo at Facebook for our monthly Data Visualization Meet-up. And wow was his presentation incredible! People are still buzzing about it.
Alberto did a wonderful job of taking us through the decision making processes he’s gone through during his years of creating visualizations and infographics for many media organizations. One in particular that caught my attention was how he came about creating the cover for his book “the functional art”.
Alberto walked us through the iterative approach he took to end up with the slope graph on the cover. He sent me the data (which you can download here) so that I could emulate the design process in Tableau. Using the “Next” buttons, you can navigate through his approach to see the story unfold.






