November 28, 2018
Workout Wednesday: Sales for the Last N Periods vs. Prior Year
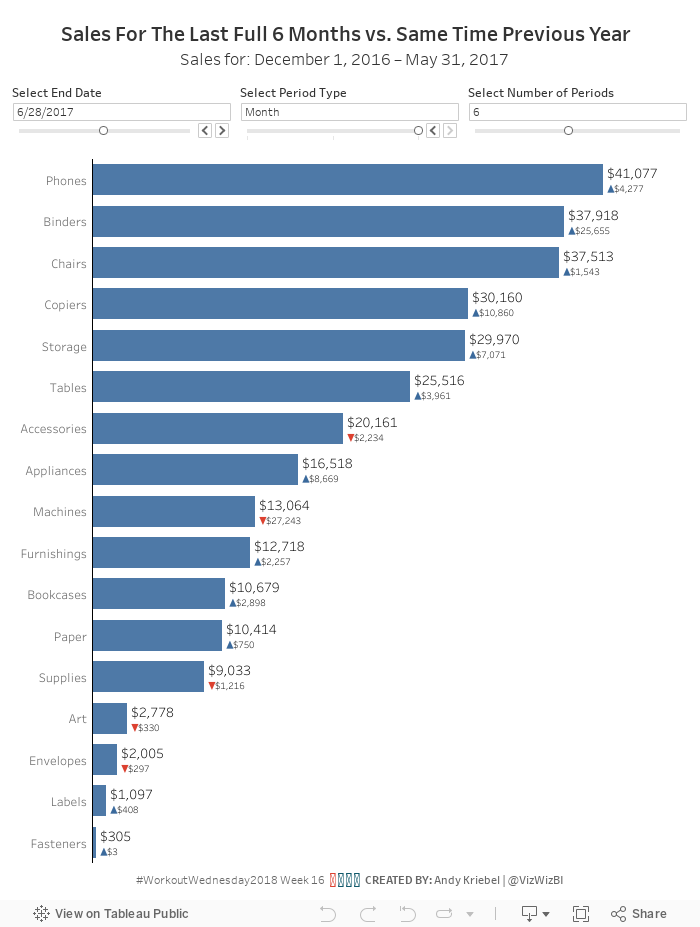
I'm going back to Workout Wednesday week 16. Why? Because I really struggled with it. I was so close for so long, but couldn't quite get my date calculations correct. After writing them down on paper and building tables in Tableau to verify I had them correct, the rest was pretty straightforward.This use case is super useful in a business context. I like Workout Wednesday challenges that you can employ later. The most important requirements:
- Use a date parameter to select a select end date, limit it to all days in 2017.
- Use a parameter to select the period type (day, week, or month).
- Use a parameter to select the number of periods to go back (limit from 1 to 12).
- Create a bar chart that show the total sales for the last complete period.
- Add sales for the same period as a label on the end of the bars.
- Compare the selected period to sales over the same period from the prior year.
- Add a blue arrow up if sales are up compared to prior year.
- Add a red arrow down if sales are down compared to prior year.
- Show the difference in sales over these time periods. Make sure to show no negative signs. The arrows will indicate the change.

Subscribe to:
Post Comments
(
Atom
)


No comments
Post a Comment