April 19, 2017
Workout Wednesday: Bollinger Bands and Tableau Stock
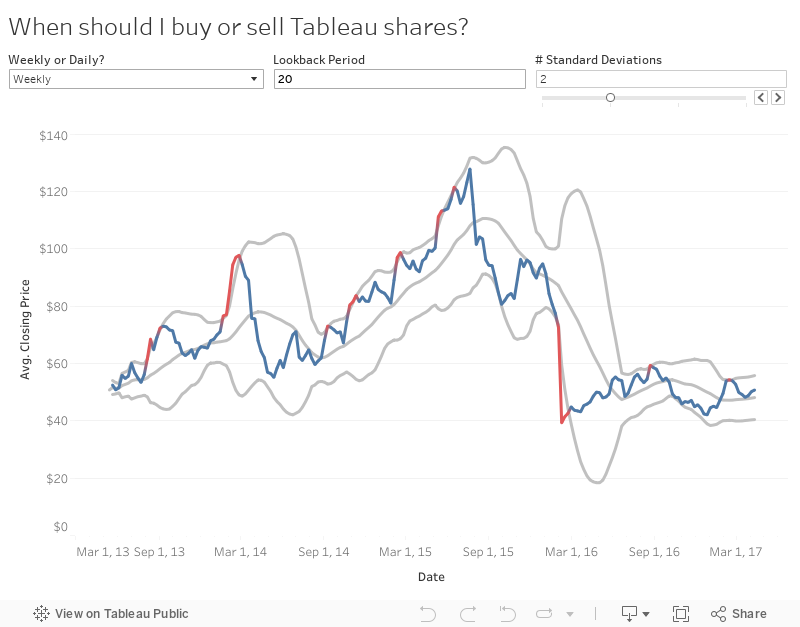
Emma had a cheeky grin on her face today when I asked her about Workout Wednesday. I'm fairly sure she was convinced that she had something tricky up her sleeve for me because, well, we're a bit competitive.This week she challenged us to build a Bollinger Band chart based on Tableau's stock performance.
Fortunately for me I had already done nearly this exact chart back in 2014 as a tip here and as a video here. Heck, it was even based on Tableau's stock! How convenient is that!#WorkoutWednesday week 16 is now up: Should I buy Tableau shares? https://t.co/GOVDlm8i7H pic.twitter.com/e2yA0dNr1F— Emma Whyte (@EmmaWhyte) April 19, 2017
Emma threw in a couple nice nuggets in her tooltips that required a couple calcs, but nothing overly complex. The trickiest bits are the table calcs you need for the lower and upper bounds. Mostly everything else is formatting the view.
Thanks for the challenge Emma! I'll be extra mean next week because you seemed excited about that.
Subscribe to:
Post Comments
(
Atom
)


No comments
Post a Comment