August 29, 2017
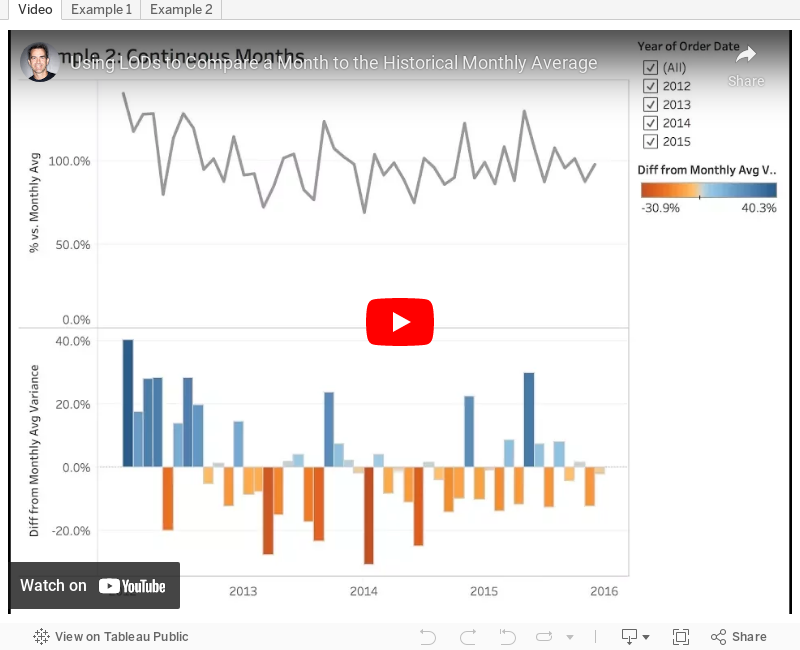
Tableau Tip Tuesday: Using LODs to Compare a Month to the Historical Monthly Average
Subscribe to:
Post Comments
(
Atom
)

© VizWiz 2009. Powered by Blogger . Blogger templates . Social Networking Scripts . Posts RSS . Comments RSS


Thank you for your sharing! It is very helpful!
ReplyDeleteOne quick question: if I only want the average for the year of 2014 and 2015 and draw a graph for data of these two years. How may I approach it?
Thanks!
Inside of the LOD after the : you would do something like : IF Datepart('year',[Date])=2014 OR Datepart('year',[Date])=2015 THEN [Sales] ELSE 0 END }
DeleteThanks for sharing this. This is exactly what I was looking for, except now I also need the average of the last 2 years only (by month). I tried adding IF statement in LOD and it's not returning the correct result.
Delete{ FIXED DATEPART('month',[Date]): AVG(
{ FIXED DATETRUNC('month', [Date]): SUM(IF Datepart('year',[Date])=2016 OR Datepart('year',[Date])=2017
THEN [Number of Records] ELSE 0 END)})}