June 13, 2018
Workout Wednesday: Do Customers Spend More on Their First or Second Purchase?

The high-level requirements:
- Create a data set in Tableau Prep that returns the first and second order for each customer along with the sales, number of categories and number of products sold on that day.
- The data must be wide rather than tall. That is, you must have nine columns in total: Customer ID, two dates, two sales totals, two category counts, two product counts.
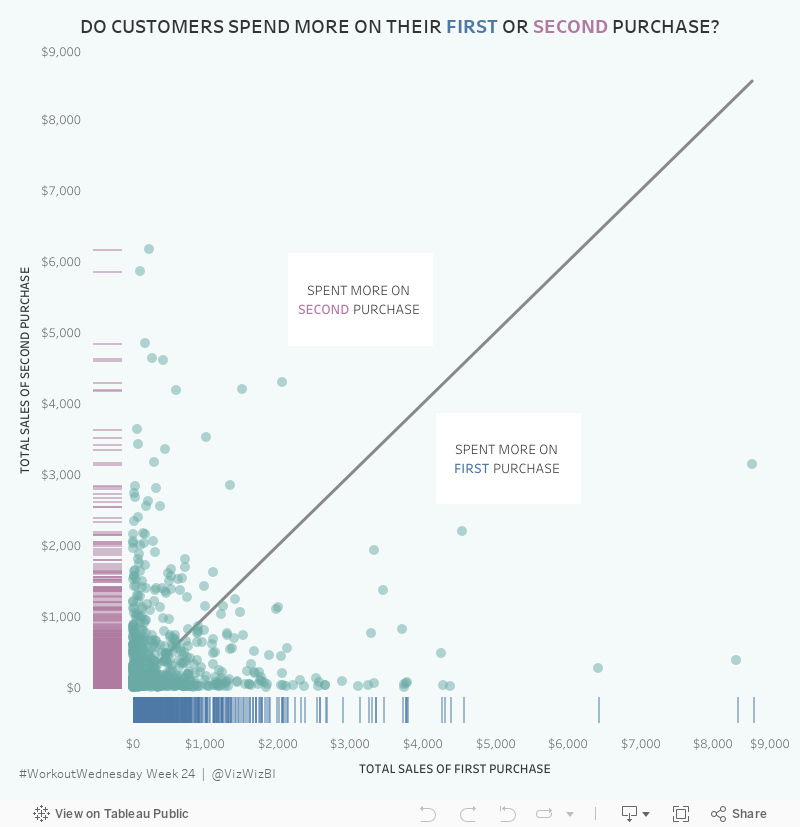
- Create a dashboard with a scatterplot and two strip plots.
- Float everything...YUCK!
Here's what my flow looks like from Prep:

I intentionally did NOT rename my tools so that you wouldn't know exactly what I did. You can see my final output below the flow.
Building the viz was pretty simple. Scaling the axes the same is something I do a lot, but I do expect that to trip up people. Creating the 45º line is something I've written a tip on before, but Ann's has a twist as it has to be behind the dots. Sneaky!
The sucky part was floating everything. I started by tiling everything, literally writing down the position and size for each element. Then I floated them one by one and entered what I wrote down to put them back in their proper position. From there, it was a little bit of tweaking to move the axes closer together.
Nice challenge. It wasn't overly complex and required me to reach back into the memory bank.

Subscribe to:
Post Comments
(
Atom
)


No comments
Post a Comment