May 28, 2019
#TableauTipTuesday: Create an Interactive Quadrant Chart with Parameter Actions

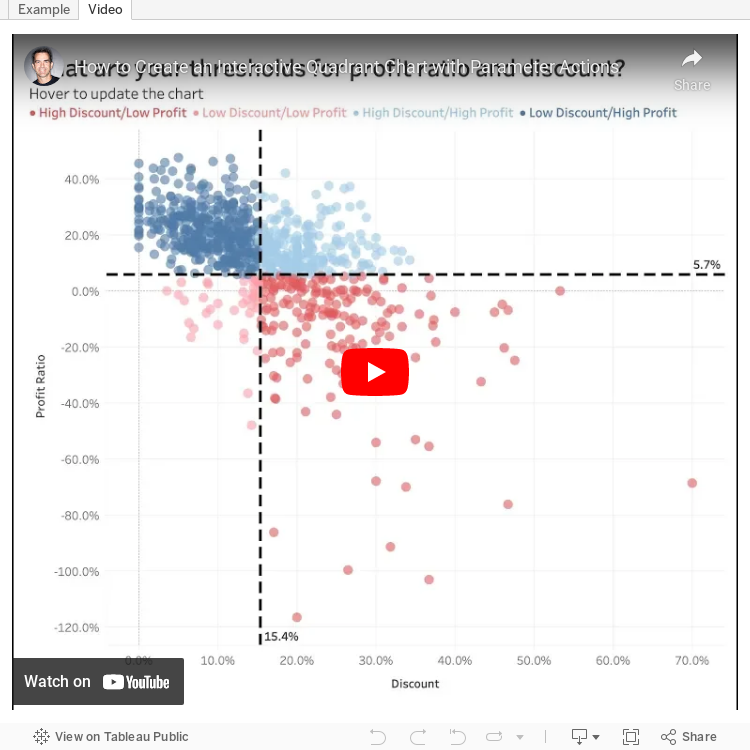
The first chart I wanted to try was a quadrant chart. A quadrant chart colors each quadrant based on thresholds set for each axis in a scatter plot. Previously, I created two parameters and the user had to type in numbers to adjust the view. However, with parameter actions, I can now enable to use to update the quadrants by simply hovering over a dot.
And here's the video...enjoy!
Subscribe to:
Post Comments
(
Atom
)


No comments
Post a Comment