September 14, 2021
#MakeoverMonday 2021 Week 37 - The World's Largest Solar Power Plants
bar chart
,
color
,
drill down
,
energy
,
format
,
formatting
,
how to
,
Makeover Monday
,
number format
,
parameter
,
set action
,
solar power
,
table calculation
,
tooltip
,
WatchMeViz
No comments

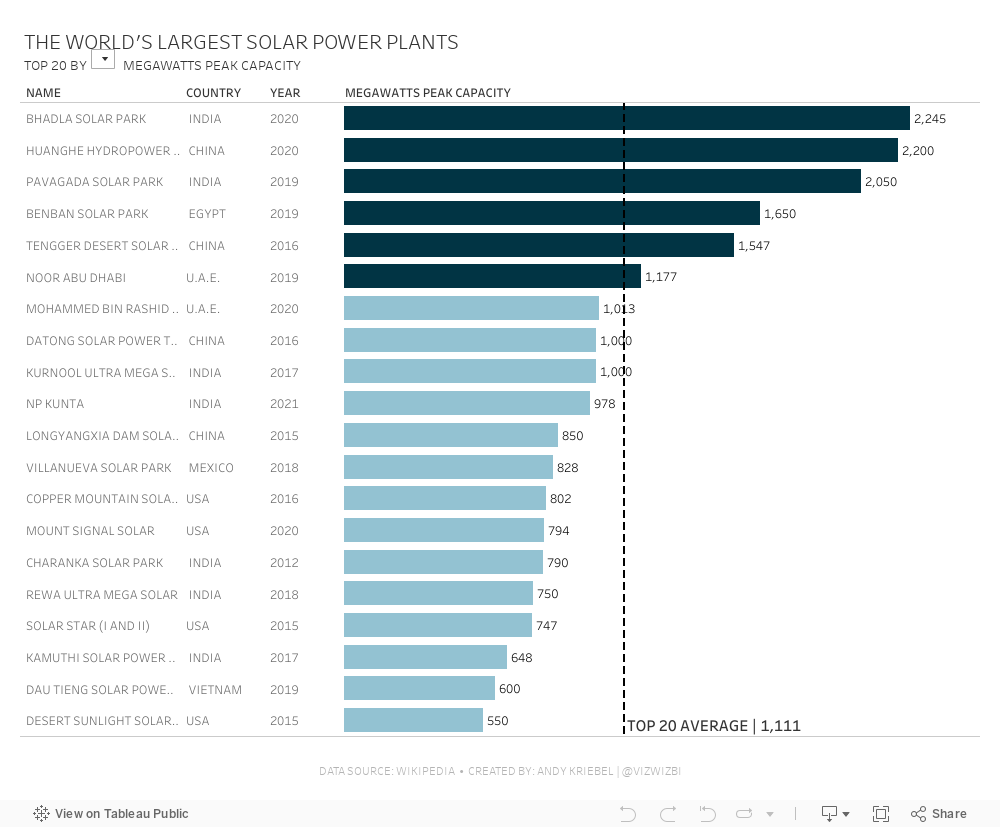
If you have a look at the video below, you'll see me create a drill down action, using a boolean table calc to color the bars, create a parameter to choose a metric, and lastly I show you how to create different number formats for a single calculation.
Subscribe to:
Post Comments
(
Atom
)


No comments
Post a Comment