September 29, 2021
#MakeoverMonday 2021 Week 39 - MLB All-Time Offensive Wins Above Replacement
baseball
,
calculated field
,
dashboard
,
dynamic
,
how to
,
Makeover Monday
,
MLB
,
parameter
,
quadrant chart
,
scatterplot
,
stats
,
summarize
,
table calc
,
war
,
WatchMeViz
,
wins above replacement
No comments

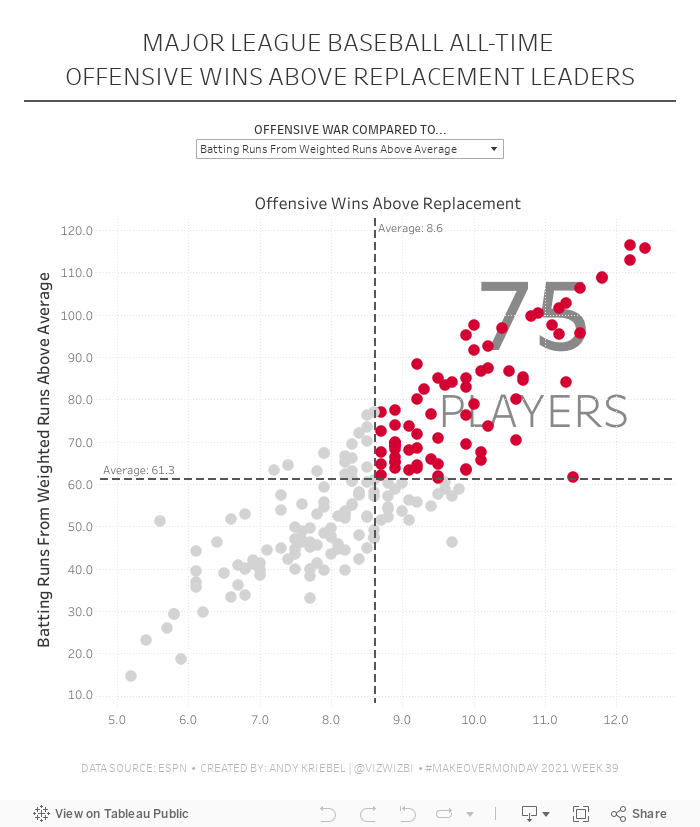
There are several, even more confusing stats included. I thought the easiest way to compare them would be with a scatterplot. So I made an interactive scatterplot that highlights players that are above the average of the top 200 players.
If you watch the Watch Me Viz video (below), you'll see how I used table calcs to highlight those players and also count the number of players in that quadrant. You'll learn how to use parameters to create a dynamic scatterplot, plus some other bits along the way.
Thanks for coming along on this 300 week journey with me. I hope you have developed your skills and become better at your work. Until next time...
Subscribe to:
Post Comments
(
Atom
)


No comments
Post a Comment