Showing posts with label looks. Show all posts
January 3, 2018
Workout Wednesday: Looks vs. Personality
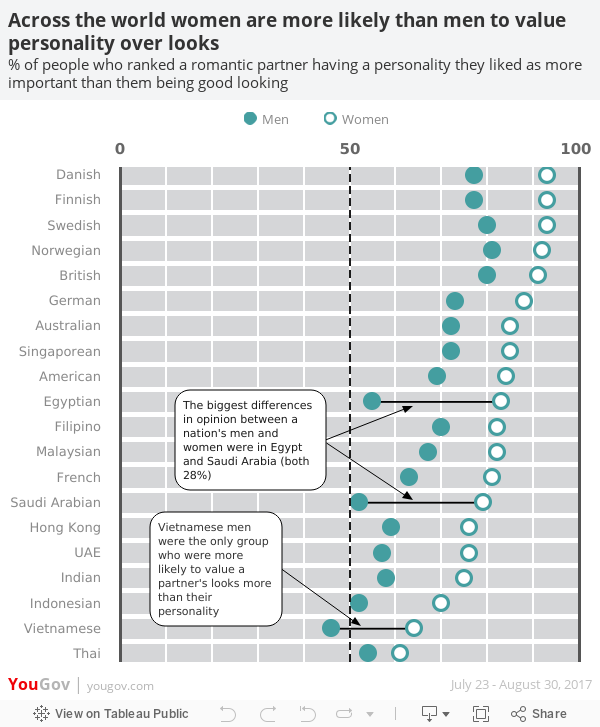
Ok, so for week 53, you need to recreate this viz, which is a remake of a viz from YouGov and one which I wrote about before.

Requirements
- Get the data from data.world
- I used the Raleway font, but if you can't use it, don't worry about it.
- The dot plot must show a close circle for men and an open circle (filled white) for women.
- There should be two annotations that point to three places.
- The three places where the annotations points to must show the dots connected.
- The dashboard is 600x700.
- Match the title, legend and footer.
- Match the tooltips.
- There must be solid vertical lines for 0 and 100 and a dashed line at 50 with labels for each at the top of the viz.
- There must be white vertical gridlines every 10%.
- There must be white space between each nationality.
I think that's everything. If not, let me know. Post a link on Twitter and tag @VizWizBI, @EmmaWhyte and @RodyZakovich. Thanks for all of your participation this year and I look forward to seeing how Rody take it forward.
Good luck!
December 8, 2017
Looks vs. Personality - A Tableau Remake
dot plot
,
looks
,
makeagain
,
personality
,
remake
,
YouGov
No comments
Yesterday I wrote about a great viz from YouGov and in that post I wrote about some of the things I wanted to see improved in the viz. As a way for me to learn, I decided to try to rebuild the viz in Tableau, mostly because I knew it wouldn't be straightforward, and also to address some of the areas for improvement. There were quite a few tricks I had to mix together to make it work and I learned a ton along the way.
If you ever need a great way to learn, find a viz you like and rebuild it. You won't regret it.

If you ever need a great way to learn, find a viz you like and rebuild it. You won't regret it.
Subscribe to:
Posts
(
Atom
)






