Showing posts with label YouGov. Show all posts
December 6, 2022
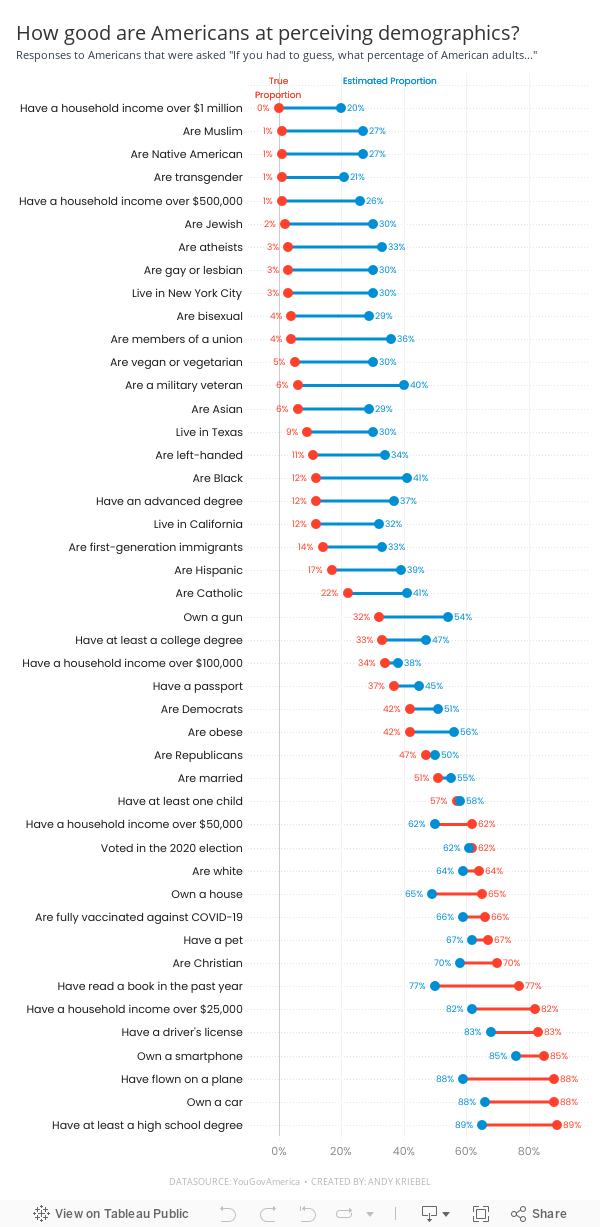
#MakeoverMonday Week 49 - How good are Americans at perceiving demographics?
America
,
barbell chart
,
color picker
,
dashboard
,
dot plot
,
formatting
,
gridlines
,
how to
,
labels
,
line chart
,
Makeover Monday
,
measure names
,
measure values
,
reference line
,
survey
,
tableau
,
tooltip
,
YouGov
No comments

Easy to replicate:
- Barbell chart with dots on the ends and a line connecting them
- Coloring the lines by the larger value
- Choosing the colors
- Formatting the view (except the labels)
Challenges/things that should be easier:
- Labeling the dots/ends of the lines; this took several iterations on the calculations
- Creating the color legend as headers; I had to use reference lines, turn on totals, move the totals to the top, then work on the formatting to get them close. They still aren't perfect.
- Creating the horizontal reference lines; this required me to create a dummy axis
While there are only 3 challenges, I estimate those three challenges took 75-80% of my time. I can only imagine how much more productive I could be if formatting didn't take so long.
In the end, I'm satisfied with how close I got to recreating the original chart. I like the additional context I added by coloring the lines connecting the dots.
If you missed #WatchMeViz, check it out below. Below the video is my final visualization.
May 17, 2021
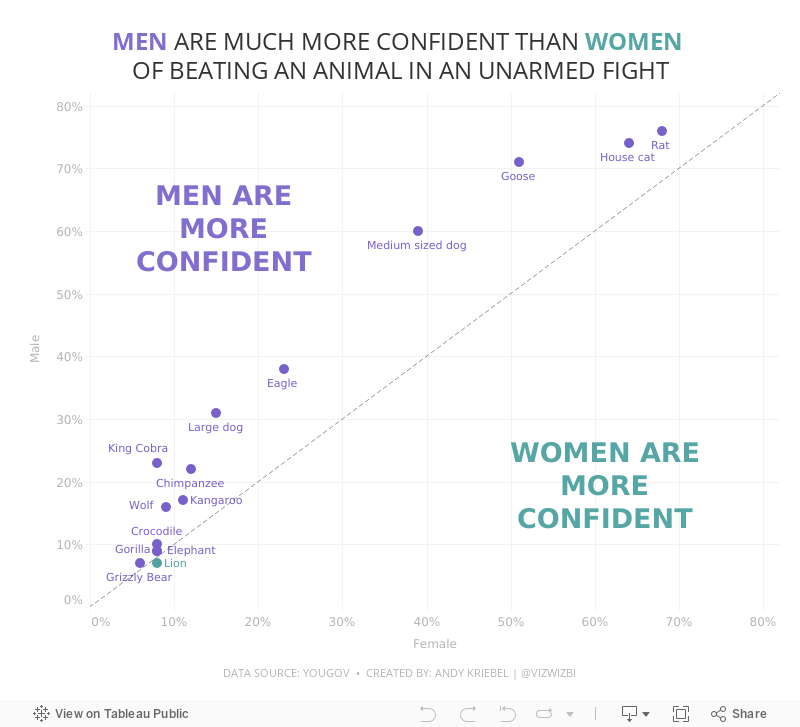
#MakeoverMonday Week 20 - Humans vs Animals
animals
,
bar chart
,
barbell chart
,
charts
,
context
,
diverging bar chart
,
gender
,
graphs
,
human
,
Makeover Monday
,
men
,
radar graph
,
scatter plot
,
tableau
,
United States
,
USA
,
variance
,
WatchMeViz
,
women
,
YouGov
No comments

WatchMeViz
Visualization
September 1, 2019
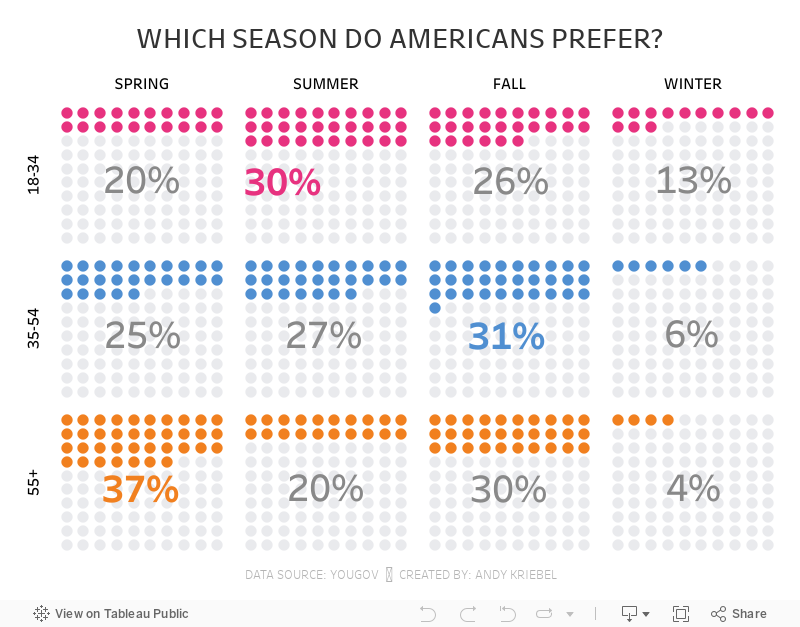
#MakeoverMonday: Which season do Americans prefer?
bar chart
,
comparison
,
fall
,
Makeover Monday
,
season
,
spring
,
summer
,
winter
,
YouGov
No comments

 |
| SOURCE: YouGov |
What works well?
- The seasons are sorted according to when Americans experience them.
- Nice clean design
- Labeling the tops of the bars
- Hiding the axis
- Color are easy to distinguish
What could be improved?
- I keep having to refer back to the legend. Maybe label each bar once?
- This show a comparison of the ages within a season. If the viewer wants to compare the seasons by age, then that become difficult.
And here's my version, which allows you compare both across seasons and across age groups:
October 31, 2018
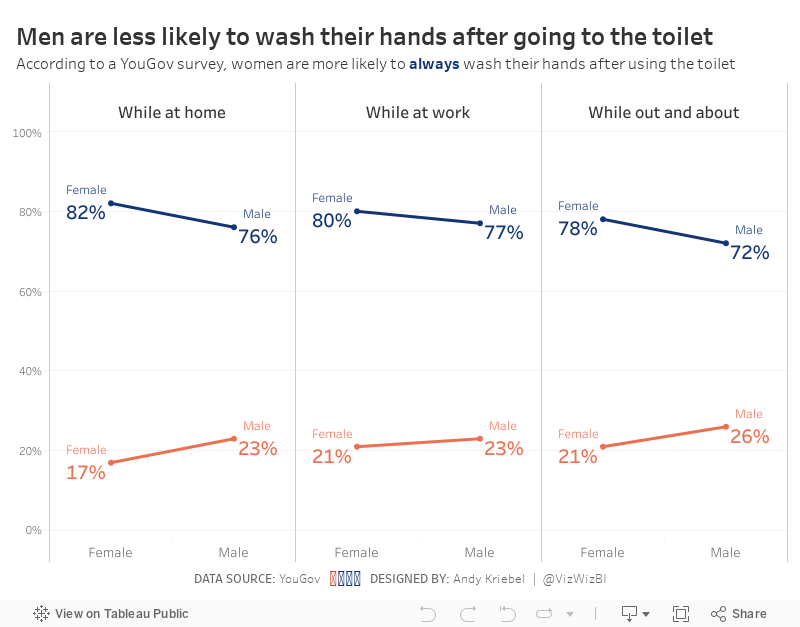
Makeover Monday: Women are more likely to always wash their hands after using the toilet
bathroom
,
hand washing
,
Makeover Monday
,
men
,
pee
,
poo
,
survey
,
toilet
,
women
,
YouGov
No comments

Anyway, onto the viz to critique:
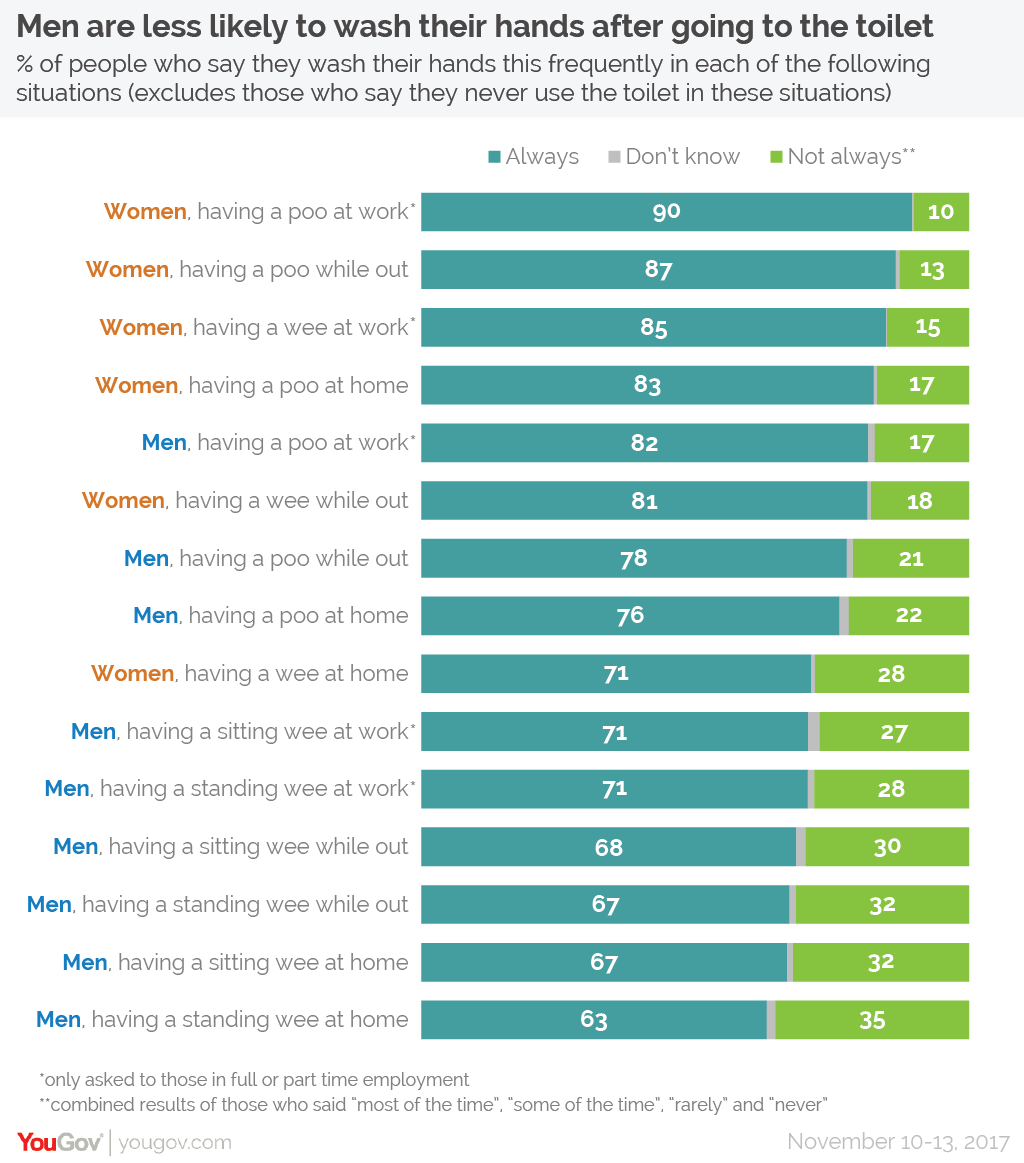
What works well?
- The design of the responses as a stacked bar chart is easy to understand.
- The responses are ordered from highest to lowest.
- Women and men are assigned difference colors in the text
- Good title and subtitles
- Colors are easy enough to distinguish
What could be improved?
- Comparisons between women and men in the same categories are hard to make
- Maybe there could be an easier way to distinguish between poo and pee
My Goals
- Do something quick (like 10 minutes); I'm late for MM for the first time ever, but it's ok because I'm on holiday with my Dad and Brother.
- Make the comparisons easier
- Use colors that are a bit easier to associate to the men and women categories
With that in mind, here's my Makeover Monday for week 44 2018.
January 3, 2018
Workout Wednesday: Looks vs. Personality
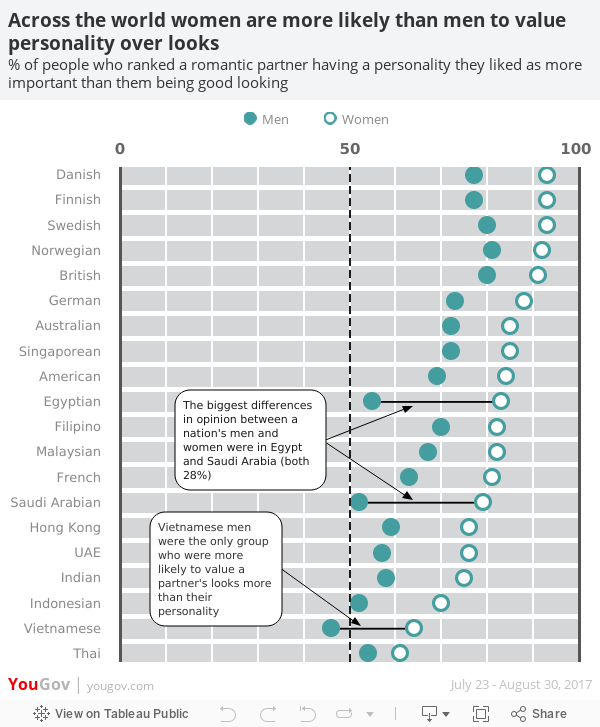
Ok, so for week 53, you need to recreate this viz, which is a remake of a viz from YouGov and one which I wrote about before.

Requirements
- Get the data from data.world
- I used the Raleway font, but if you can't use it, don't worry about it.
- The dot plot must show a close circle for men and an open circle (filled white) for women.
- There should be two annotations that point to three places.
- The three places where the annotations points to must show the dots connected.
- The dashboard is 600x700.
- Match the title, legend and footer.
- Match the tooltips.
- There must be solid vertical lines for 0 and 100 and a dashed line at 50 with labels for each at the top of the viz.
- There must be white vertical gridlines every 10%.
- There must be white space between each nationality.
I think that's everything. If not, let me know. Post a link on Twitter and tag @VizWizBI, @EmmaWhyte and @RodyZakovich. Thanks for all of your participation this year and I look forward to seeing how Rody take it forward.
Good luck!
December 8, 2017
Looks vs. Personality - A Tableau Remake
dot plot
,
looks
,
makeagain
,
personality
,
remake
,
YouGov
No comments
Yesterday I wrote about a great viz from YouGov and in that post I wrote about some of the things I wanted to see improved in the viz. As a way for me to learn, I decided to try to rebuild the viz in Tableau, mostly because I knew it wouldn't be straightforward, and also to address some of the areas for improvement. There were quite a few tricks I had to mix together to make it work and I learned a ton along the way.
If you ever need a great way to learn, find a viz you like and rebuild it. You won't regret it.

If you ever need a great way to learn, find a viz you like and rebuild it. You won't regret it.
June 24, 2016
The Day Before the EU Referendum
brexit
,
EU
,
europe
,
referendum
,
UK
,
united kingdom
,
YouGov
No comments
Today at the Data School the team was supposed to present Tableau Server adminstrator views, but given yesterday’s historic decision by the citizens of the U.K. to leave the EU, we pivoted and focused our day on visualisation data about the referendum.
I wanted to participate as well, and quickly found this survey on YouGov.UK. This poll was taken just before the vote, seemingly a good proxy for the next day’s vote.
Subscribe to:
Posts
(
Atom
)






