Showing posts with label marketing. Show all posts
September 3, 2018
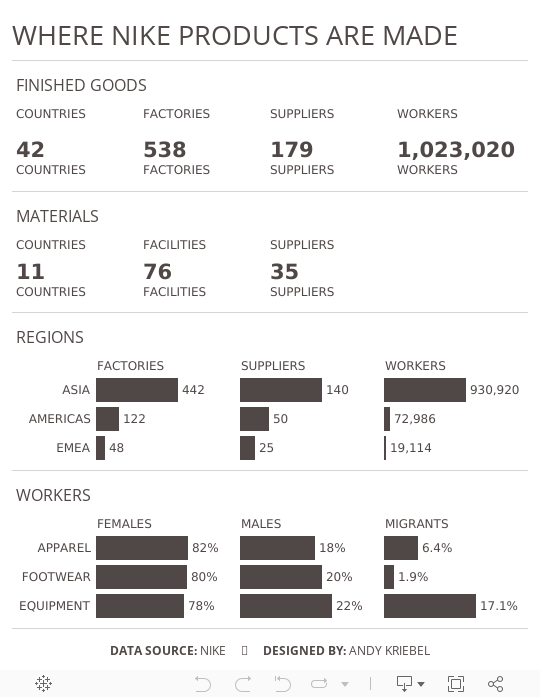
Makeover Monday: Where Nike Products Are Made


What works well?
- The summary card on the right is packed full of information and as you zoom, you get different levels of detail.
- Keeping the map a single color allows you to focus on where the factories are located.
- Excellent interactivity
- Overall, everything is simple and clean.
What could be improved?
- Adding some filtering capabilities
- Make it easier to identify the smaller countries, possibly by outlining the countries with a white border.
What I did
- Mimic the style of the cards with its BANs
- Make some of the importion that's buried deeper in the map more evident
- Use Nike official colors
- Add some simple interactivity through actions
This is a pretty simple viz this week and I really enjoyed making it. It's almost like a report card.
June 28, 2013
Chart of the Day Makeover: Samsung’s rocketing marketing expenses
bar chart
,
Chart of the Day
,
color blind
,
line chart
,
makeover
,
marketing
,
samsung
,
tableau
,
trend
,
variance
11 comments
Chart of the Day recently published an article on Samsung’s Insane Marketing Budget whose primary purpose was to show how Samsung’s budget has increased over time. The article also pushes the reader towards comparing Samsung to other companies included in the chart. To do so, COTD presented this bar chart:

Before we makeover this bar chart, let’s examine it.
- It’s pretty straight forward to compare the years within a single company, but the emphasis is on time, which means a line chart should be the natural first choice.
- But wait. The years are in reverse chronological order, so turn your head 90 degrees to the left and look at the chart. Without referring to the legend, one would likely assume that the most recent year was at the bottom of each set of bars.
- The bars are colored by year, which makes the comparisons across companies for a given year possible, but not easy. It’s easier to compare the years if they’re grouped together.
- Each bar uses gradient coloring and shadowing. Why? What value does this add?
- They’re using red and green bars together. They’re not thinking about the color-blind folks out there. They should be using natural, color-blind friendly colors.
To address these issues, I’ve created the following viz using Tableau. Download a free trial here.

With this viz, you can now see:
- The trend for each company. It’s much easier to see the large increase in Samsung’s budget, while all of the others in the view are relatively flat.
- I thought it was important to emphasize the difference between Samsung and the other companies, thus the five small line charts, which all clearly show how much more Samsung is spending.
How would you do this differently? Download the data here and the workbook here.
Subscribe to:
Posts
(
Atom
)






