Showing posts with label pitching. Show all posts
October 24, 2022
#MakeoverMonday Week 43 - How have Major League Baseball Pitch Types Changed?
baseball
,
change
,
color
,
comparison
,
custom number format
,
group
,
level of detail
,
LOD
,
Makeover Monday
,
MLB
,
pitching
,
pivot
,
set action
,
sets
,
sparklines
,
tableau
,
trellis chart
,
WatchMeViz
No comments

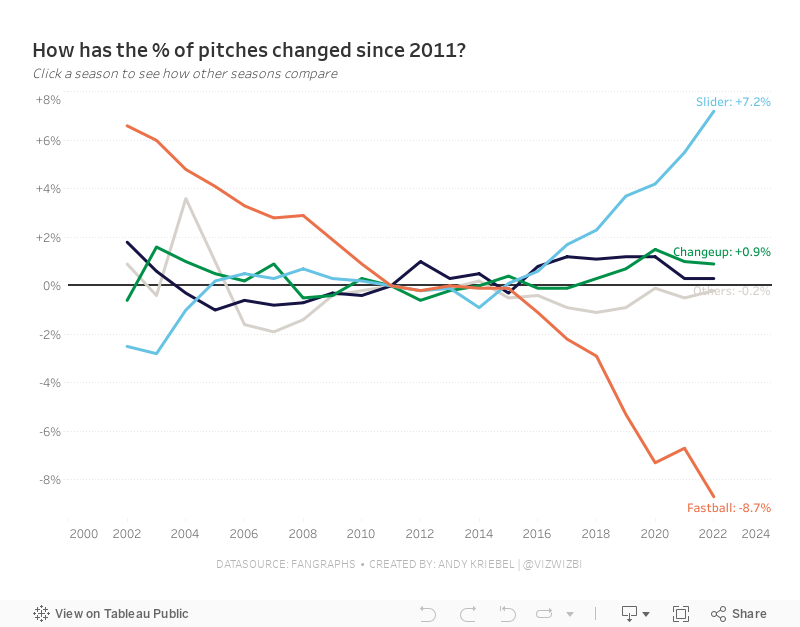
This week's data set was pretty simple. We had 21 baseball seasons and a column for each pitch type. Pivoting the metrics made it much easier to work with for me as I could then split the view by pitch type.
During #WatchMeViz (below), I create a trellis view, showed how to create groups, sets, set actions, sparklines, LODs, custom number formatting, creating a mobile view, and more.
Thank you for tuning in. Here's the video and below is my visualization.
September 26, 2009
The Big 3
atlantabraves
,
baseball
,
bobbycox
,
gregmaddux
,
johnsmoltz
,
pitching
,
stats
,
tomglavine
2 comments
My friend Dan Murray left a comment on my previous post about Bobby Cox's retirement. Dan brought up an interesting point that Maddux, Smoltz and Glavine might be tougher for the Braves to replace than Cox. I thought I'd look into it.
Some notes to the data:

I find all of this quite impressive. Sure, they made a lot more money, but they backed it up. Their ERA was 21% better than the rest of the team, they won 9% more games, clearly had a better ERA year after year, and more than pitched their fair share of innings.
In fact, the most impressive stat to me is that between 1993-1998 the Big 3 threw 50.3% of the total innings for the Braves. Three pitchers throwing that many innings is simply incredible. I can't imagine there are too many, if any, teams in the last 50+ years that could even come close to that.
Some notes to the data:
- This data covers 1991-2008 (the entire period that they pitched for the Braves). During this time Smoltz was a Brave for all 18 years, Maddux was with the Braves from 1993-2003 and Glavine from 1991-2002.
- Smoltz was the Braves closer for the 2nd half of 2001 through the 2004.
I find all of this quite impressive. Sure, they made a lot more money, but they backed it up. Their ERA was 21% better than the rest of the team, they won 9% more games, clearly had a better ERA year after year, and more than pitched their fair share of innings.
In fact, the most impressive stat to me is that between 1993-1998 the Big 3 threw 50.3% of the total innings for the Braves. Three pitchers throwing that many innings is simply incredible. I can't imagine there are too many, if any, teams in the last 50+ years that could even come close to that.
Subscribe to:
Posts
(
Atom
)






