November 27, 2009
Sometimes a dual axis is not a dual axis
comparison
,
DanGreen
,
dual axis
,
economy
,
FRED
,
interest rates
,
mortgage
,
tableau
,
variance
No comments
I learned something after my last post, thanks to my friend and co-visual analysis geek (or is it enthusiast??) Joe Mako. The title from the graph I was referring to was "Fed Funds Rate vs. 30-Year Fixed." That right there should have told me the graph was a comparison, but the fact that there was an axis range on both sides of the graph, led me immediately to assume it was a dual axis chart. We all know why you don't assume...Joe point out to me that the subtitle is "Interest Rate Differential Since 2000." That's the key to the chart...differential. Maybe it says something about the chart that I didn't notice the subtitle or that my eyes were drawn to the ranges on both axes, but I made a mistake. Phew, that felt good to say.
Joe recommended recreating the graph that I had previously posted with a single axis range, since the ranges were so close already.

I also wanted to look at the differential, since the author's point was to show that the differential between the Fed funds rate and the 30-year fixed mortgage rate was that the Fed funds rate only influences the 30-year fixed rate. If the Fed established mortgage rates, then the chart would be completely linear, which it clearly is not.

I chose the color red since the farther from the zero axis, the less influence the Fed has on mortgage rates. The darker the red, the less the influence.
I also changed the title so that it would be more clear what the chart was comparing. The author of the article titled the chart "Fed Fund Rate vs. 30-Year Fixed." When I recreated the chart, I simply took the Fed rate and subtracted the 30-year fixed rate, but that made the chart a mirror image of the author's, meaning that he had the title backwards in my opinion, thus the title I arrived at.
The bottom line is that I agree with Dan Green's evidence...the two rates are NOT strongly correlated.
November 25, 2009
The Fed Fund Rate: Establish or Influence?
DanGreen
,
dual axis
,
economy
,
FRED
,
interest rates
,
mortgage
,
tableau
No comments
I am always interested in what drives the economy and you often hear talk about whether or not the Fed fund rate truly drives the economy.Dan Green wrote a clear concise article on the Fed fund rate vs. the 30-year mortgage rate. There are many misconceptions, media driven I suspect, that the Fed establishes mortgage rates, however, that is not the case. As Dan points out in his article, "The Federal Reserve Does Not Make Make Mortgage Rates (And Here’s Your Proof)", the Fed merely influences rates.
Dictionary.com defines influence as the capacity or power of persons or things to be a compelling force on or produce effects on the actions, behavior, opinions, etc., of others.
It also defines establish as founding, instituting, building, or bringing into being on a firm or stable basis.
These definitions are important as you review the data.
The chart in the article is supposed to reveal this quickly and easily, but it does not. On a dual axis line chart, it measures the Fed Funds Rate vs. the 30-year fixed mortgage rate. (I'm not allowed to reproduce the image, so here is a link to it.) I cannot make heads or tails of the influence one measure has on the other on Dan's chart because there is only one line.
A dual axis chart is supposed to have two lines. The chart should look like this:

Quickly scanning this chart, there appears to be a pretty strong correlation between the two measures. The 30-year mortgage rate generally follows the same pattern as the Fed Fund Rate. If the Fed established mortgage rates, then the pattern of the 30-year mortgage would follow the pattern of the Fed Funds Rate exactly.
I wanted to verify that the Fed is only an influencer using a scatter plot. If the Fed indeed established rates, you would expect the points to line up nice and neatly.

The scatter plot strengthens the notion that the Fed rate has a significant influence on the 30-year mortgage rate, but does not establish mortgage rates.
November 5, 2009
Avitec Airline Dashboard
airlines
,
avitec
,
barchart
,
color
,
dashboard
,
dashboardinsight
,
linechart
2 comments
Dashboard Insight named the Avitec Airline Dashboard as its Dashboard of the Month for November. I can only assume that this dashboard is being recognized as a shining example, but I hope it was chosen simply by blind draw.
There are so many issues with the visual design of this dashboard. Just a couple of my observations (I could go on and on):
- The color choices, while pretty, are completely inappropriate and unnecessary. The two charts on the right are particularly horrific.
- The width to height ratio on the SAFA Ratio, Inspection Severities and Items charts are a poor choice. It looks like they are designed to ensure the screen is filled up, but they distort the story in the data.
- Why is the gigantic Avitec logo right in the middle of the Dashboard? I know it's self-serving, but it sure distracts you from interpreting the charts.
What else do you see?
November 2, 2009
Lessons from Sumi-e
From Garr Reynolds' blog Presentation Zen...8 key lessons from Sumi-e
- More can be expressed with less.
- Never use more (color) when less will do.
- Omit useless details to expose the essence.
- Careful use of light-dark is important for creating clarity and contrast.
- Use color with a clear purpose and informed intention.
- Clear contrast, visual suggestion, and subtlety can exist harmoniously in one composition.
- In all things: balance, clarity, harmony, simplicity.
- What looks easy is hard (but worth it).
Not only is this great advice for presentations, but it's essential for communicating visualizations clearly and effectively.
I'm Dizzy
If this doesn't make you cringe or make your eyeballs spin, I'm not sure what will. On top of that, I have no idea what it's trying to tell me.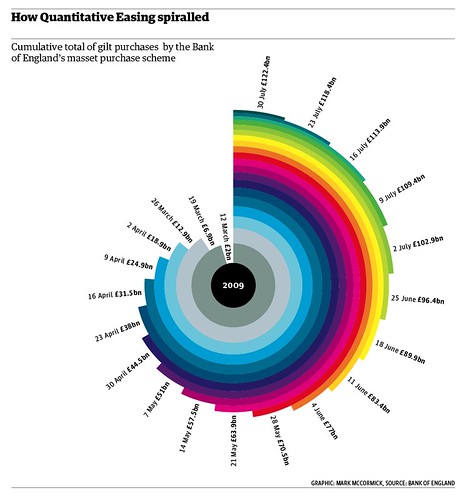
Subscribe to:
Posts
(
Atom
)


