July 14, 2015
Dear Data Two | Week 8: Instagram Addiction
addiction
,
bar chart
,
Dear Data Two
,
donut chart
,
instagram
,
jittering
,
likes
,
line chart
,
lollipop
,
running
,
story points
No comments

First, my apoloigies to Jeffrey for being so tardy getting him postcards. Getting my family moved to London and starting the Data School have gotten in the way. Kudos to him for keeping on top of this project, which has been taking way more of my time than I would have ever anticipated.
Week 8 was supposed to cover the period from May 25-31, but my data collection had a major fail. What I’ve done instead was use IFTTT to capture all pictures that I like on Instagram and log them to a Google Sheet. Note that IFTTT records the date that the picture was taken, not the date that I liked the photo, so the dataset reflects photo dates. Good enough for me!
I then exported the data from Google Sheets into Excel and did some date manipulation before importing the data into Tableau. Once I had the data in Tableau, I began to explore the data to see if any patterns emerged, focusing primarily on whether I liked running or non-running pictures the most. The story points below reflect my thought process. Enjoy!
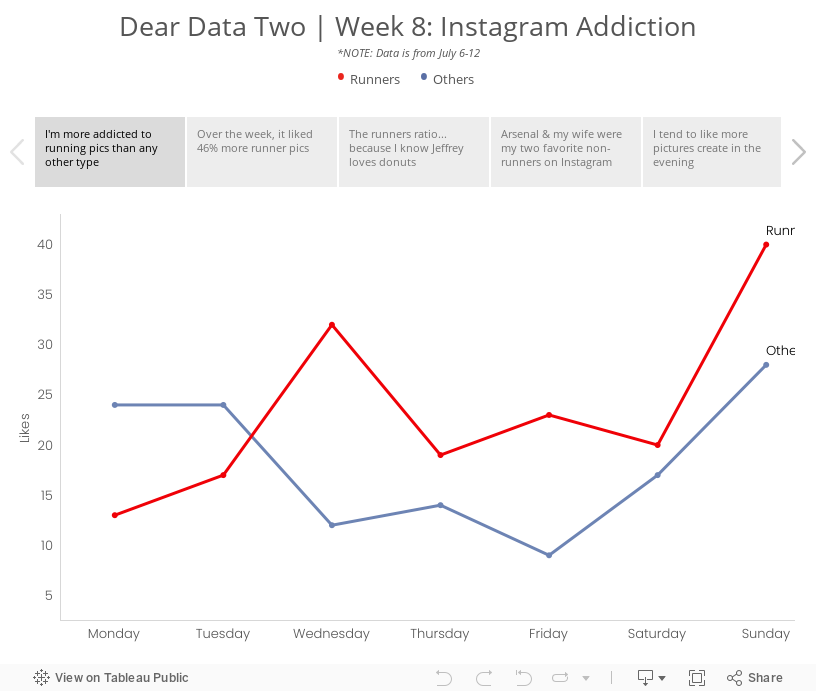
Subscribe to:
Post Comments
(
Atom
)


No comments
Post a Comment