December 28, 2015
#MakeoverMonday: Who Are Generation Z?
bar chart
,
barbell
,
confusion
,
donut chart
,
Makeover Monday
,
mislead
,
slope graph
,
visual.ly
1 comment


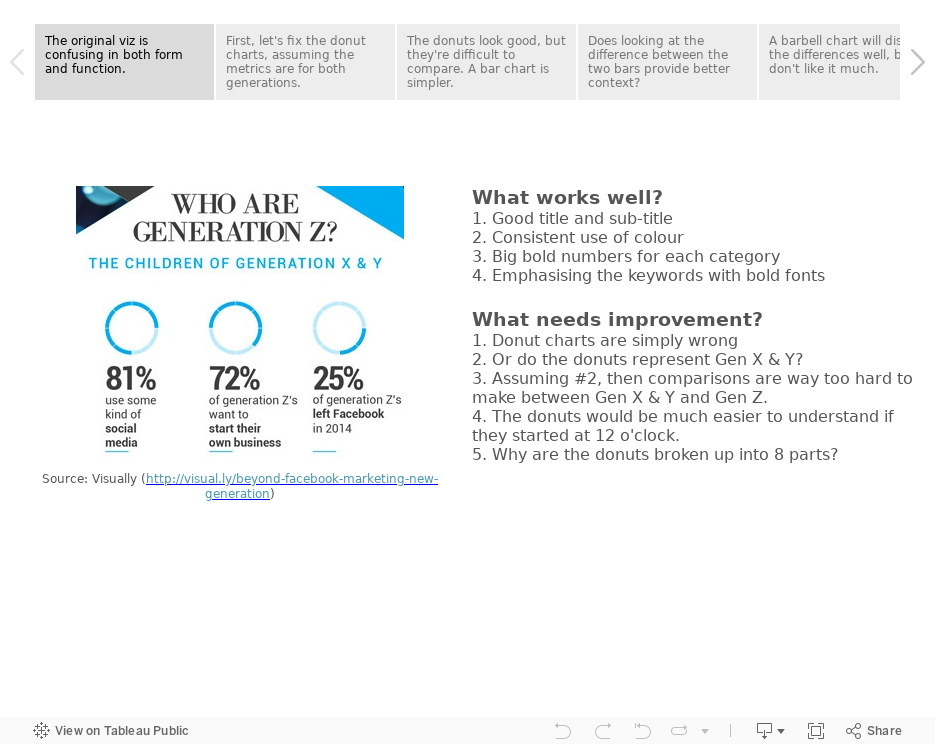
To makeover these charts, I've used Tableau's story points to:
- Discuss what works and what doesn't work
- Take you through my thought process
- Show you alternative visualisations
- Pick a final makeover
How would you do it differently? Download the Tableau workbook and have a crack at it yourself. Leave a comment with a link to your version. Enjoy!
Subscribe to:
Post Comments
(
Atom
)


Good stuff! Your thought process is really helpful, thanks!
ReplyDelete