September 30, 2018
Makeover Monday: Historical Avocados Prices
avocado
,
food
,
fruit
,
hass
,
Makeover Monday
,
price
No comments

This week's chart to makeover comes from OverRidge Wealth Advisors:
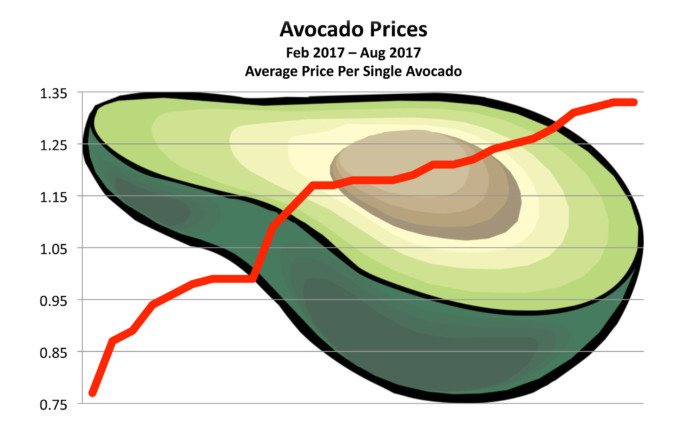
What works well?
- Using a line chart makes it easy to see the rising price.
- The title, while simple, tells us what the chart is about.
- The subtitle provides context.
What could be improved?
- There's no indication of the currency. The article mentions both US and Mexico as main sources, but the chart doesn't indicate whether it's dollars or pesos.
- The avocado in the background is distracting and completely unnecessary.
- If the avocado is removed, the line could be made black.
- Labeling the ends of the lines would add context.
- The title could be changed to something that tells the story in the data.
- Is this good or bad? Rising prices could be good if you're the produce, but bad for consumers.
- The gridlines could be more subtle.
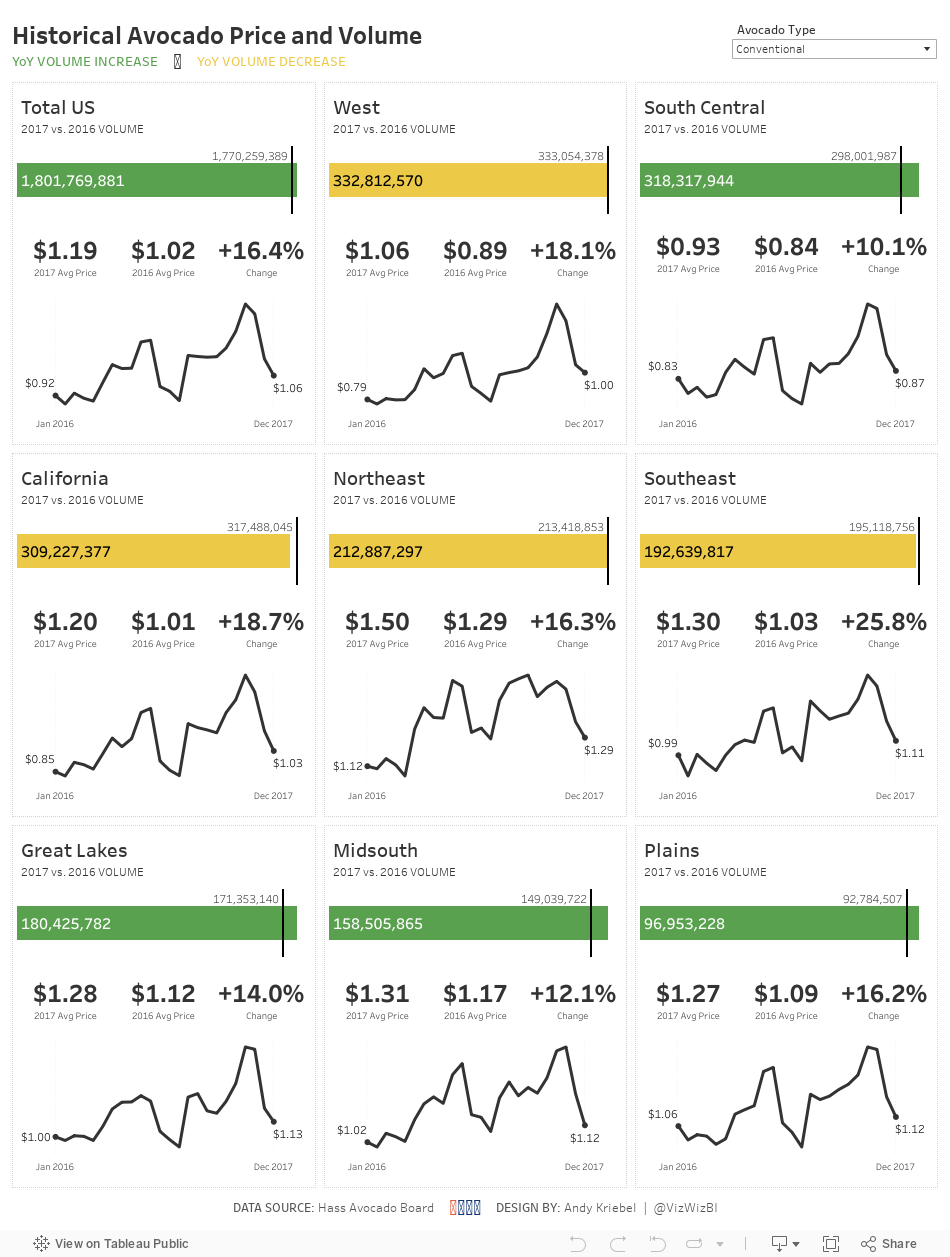
What I did
- I wanted to create something that shows the trends for each city plus the overall.
- Simplify the colors.
- Include BANs for the current price and an indicator of the change.
- Create "cards" for each region, similar to the profit and loss statement I created.
- Include a mobile version
Subscribe to:
Post Comments
(
Atom
)


No comments
Post a Comment