September 10, 2018
Makeover Monday: Spending at Trump Properties in Washington D.C.

Since Watergate, presidents have actively sought to avoid conflicts between their public responsibilities and their private interests. Every president since Jimmy Carter sold his companies or moved assets into blind trusts or broadly held investments – until now. Donald Trump never did this, despite his expansive holdings. He stands to gain personally when groups pay his companies.Let's start by looking at the chart created by ProPublica:
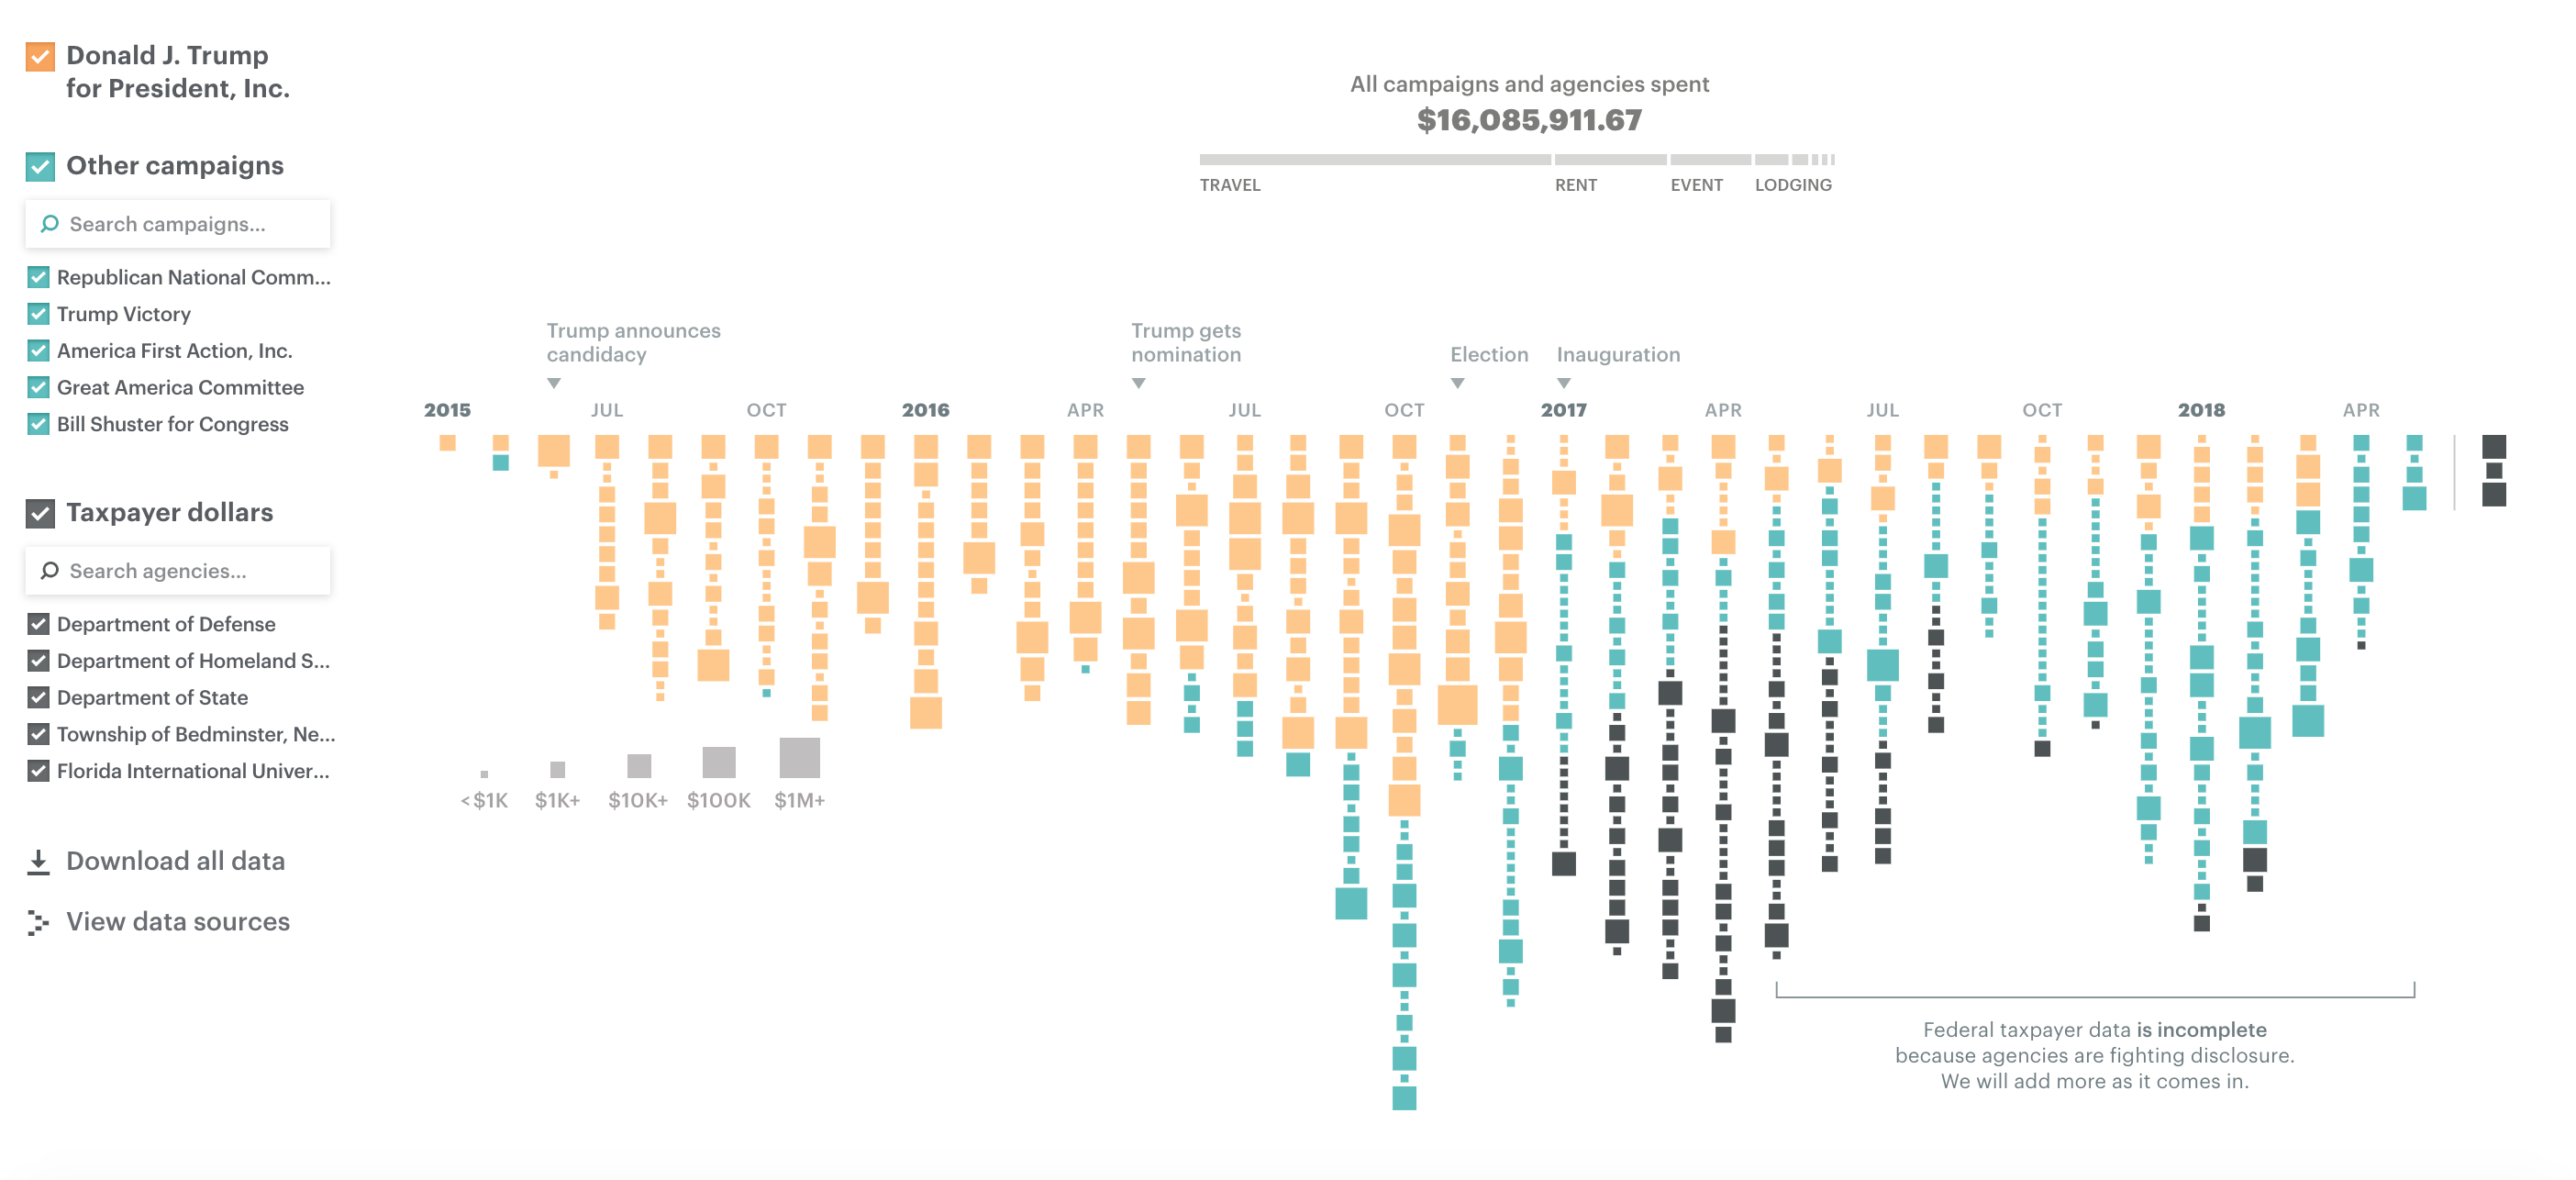
What works well?
- Colors are easy to distinguish
- Good interactivity for additional information
- Filter options are obvious and easy to use
- Sizing the blocks gives you relative comparisons
- Good use of annotations
- Stacking the blocks makes it obvious there were more records in one month versus another
What could be improved?
- Using size for the blocks makes exact comparisons difficult
- Include a title
- Include a subtitle with additional context
- Provides the user the ability to ask "How does this affect me?"
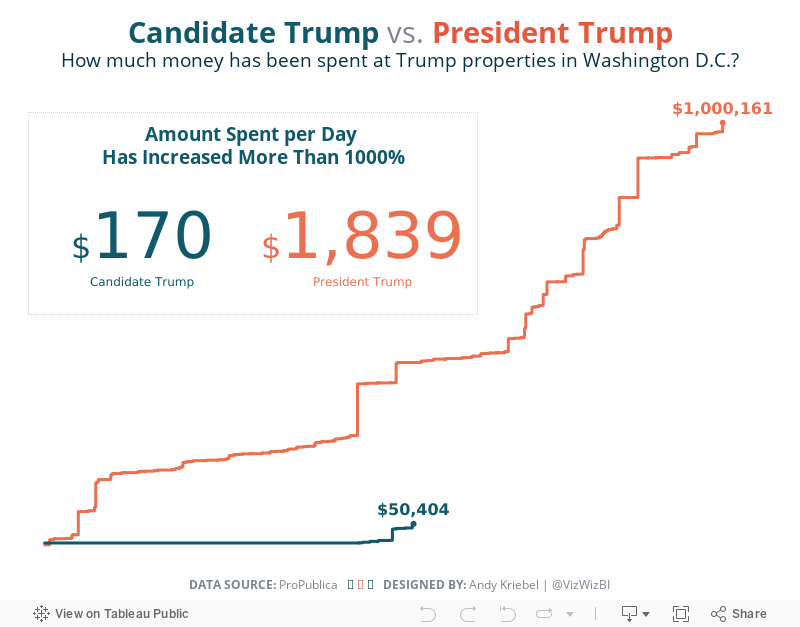
What I did
- I explored the data quite a bit, before focusing on Washington. I did this because I saw a large increase in spending after Trump was elected.
- Use simple colors like the original
- Compare spending during the Campaign vs since Trump has been President
- Use BANs to call out the import information
With that, here's my viz for Makeover Monday week 37:
Subscribe to:
Post Comments
(
Atom
)


No comments
Post a Comment