December 3, 2019
#TableauTipTuesday: How to show axis marks only at the top of a scatter plot

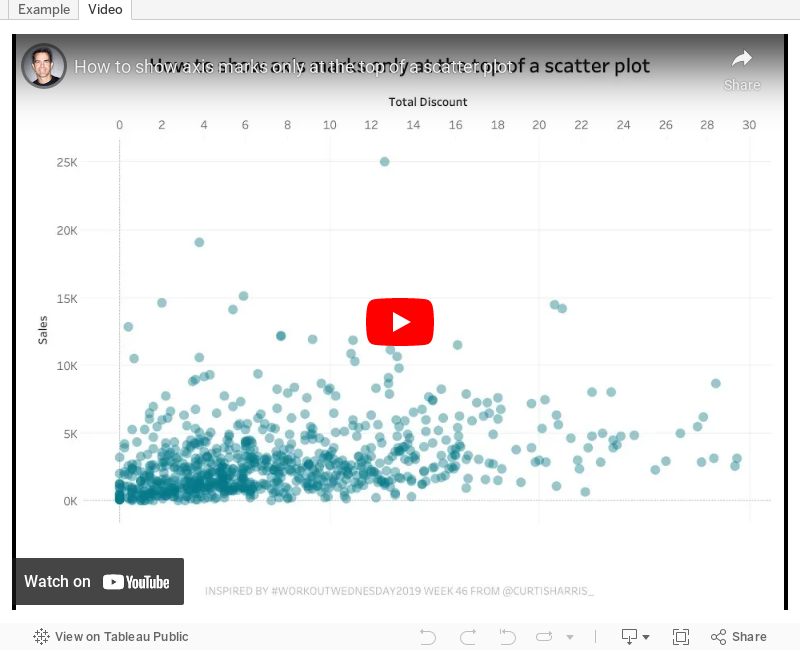
In this week's tip, I show you how to show the axis of a scatter plot only on the top of the view. Tableau doesn't provide an option to move the axis to the top, so this trick shows you a simple workaround.
Enjoy!
Subscribe to:
Post Comments
(
Atom
)


No comments
Post a Comment