August 16, 2017
Workout Wednesday: How has your home price changed?
First, you can find the housing index data here. You will need to do some minor data prep. Curtis has some hints in his post if you get stuck.
REQUIREMENTS:
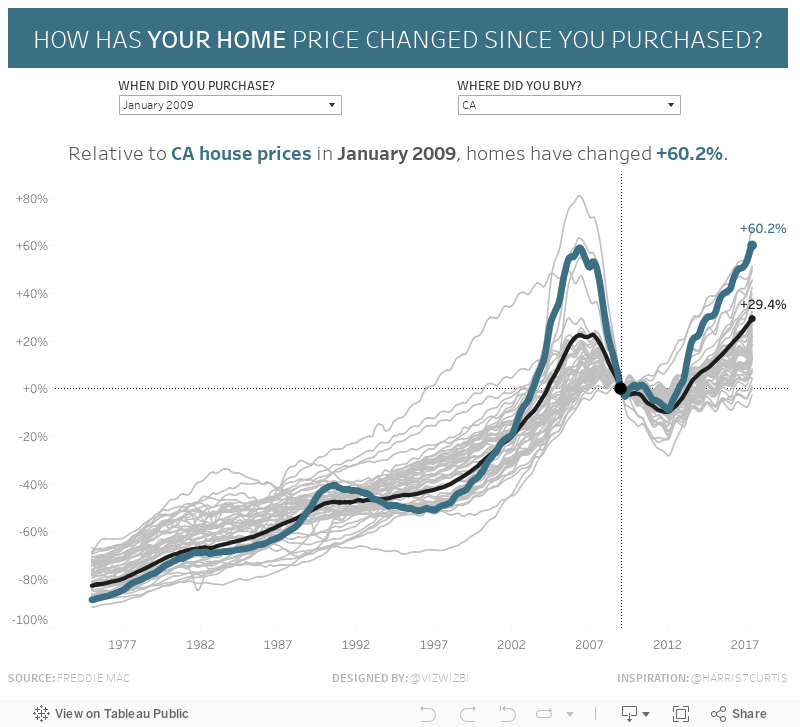
- The data is displayed as the monthly percent change in the house price index based on the date chosen above the chart.
- The State selected must be highlighted in the greenish color (#3B6F84).
- The US average must be highlighted in black.
- The most recent value should be shown on the end of the selected State and the US average.
- All States must be in the view. All States that are NOT selected should be thin and grey.
- Include a reference line for the month selected and include a dot at that point.
- Match all of my titles and formatting. Note that the chart title is dynamic.
- Match my axes.
- Match the footer (except replace my name with yours).
- Be sure to tag Curtis (@Harris7Curtis) so he gets credit when you publish it to Twitter.
Good luck!!
Subscribe to:
Post Comments
(
Atom
)


This comment has been removed by the author.
ReplyDeleteHi Ken. No, we really don't ever post how-tos. The idea was for these to be weekly challenges for people that are looking to kick on with their Tableau development and are ready the next level. These definitely are not for beginners. If you get stuck, you can always download the workbooks to see how Emma and I did them. We've taken a different approach every time.
Delete