October 19, 2017
Workout Wednesday: Market Basket Analysis
cross selling
,
market basket analysis
,
self-join
,
table calc
,
table calc filter
,
Workout Wednesday
8 comments
Emma indicated that you would need to use a PC and I'm on a Mac. This, however, didn't pose a challenge.
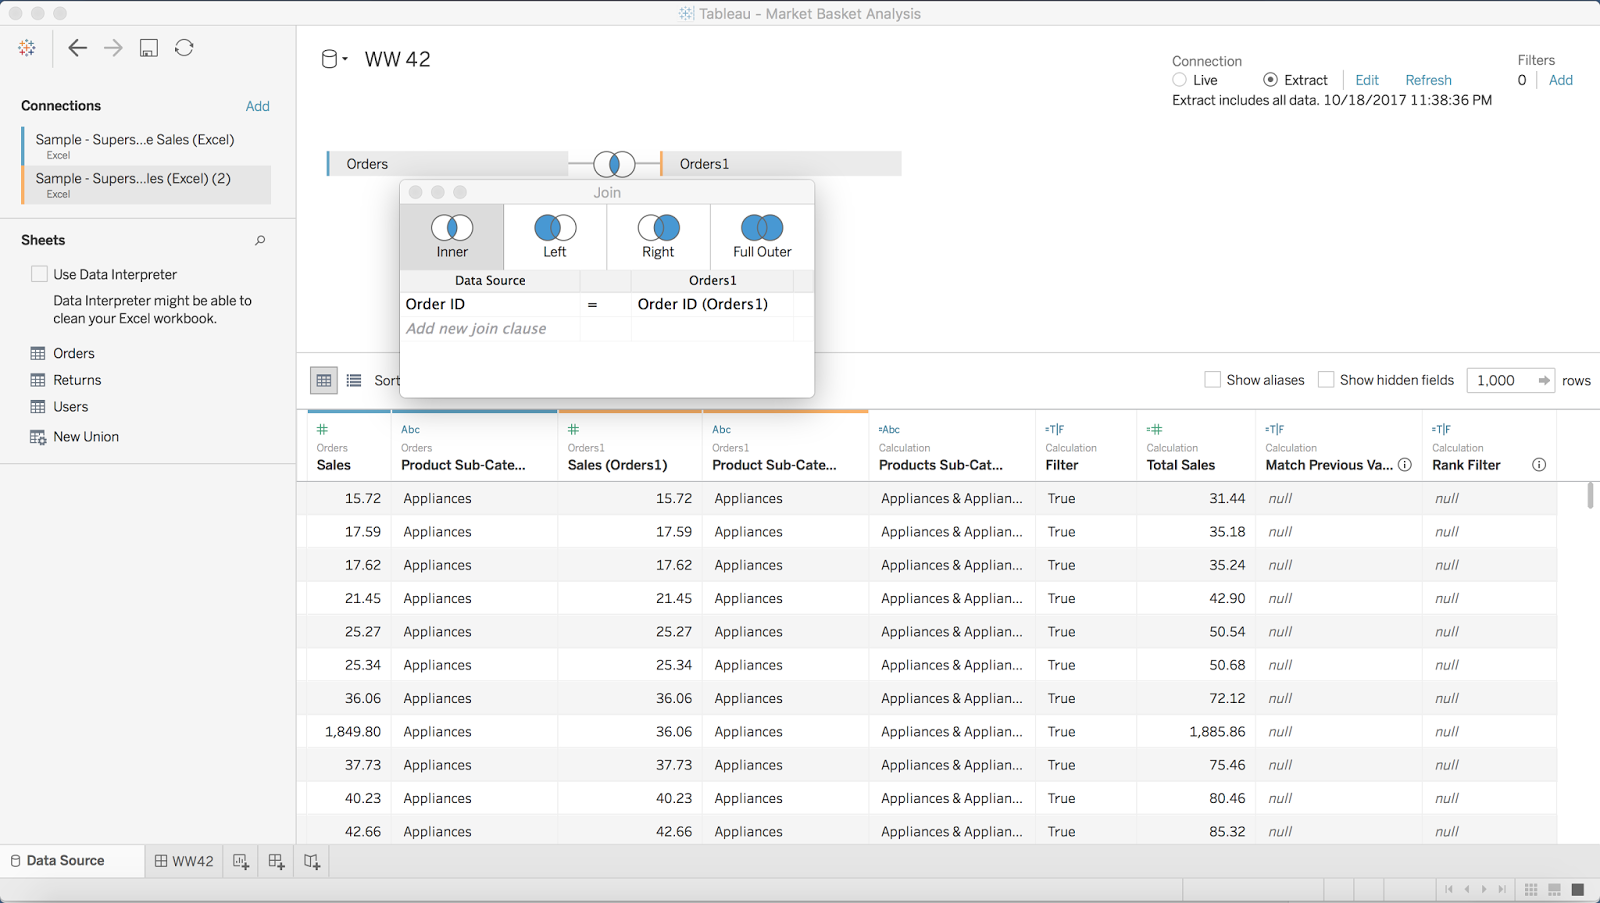
STEP 1: Join the data to itself
The idea here to join the two Orders tables by Order ID. This self-join allows us to see the cross selling of each line item in each Order ID with all other line items with the same Order ID.
STEP 2: Filter out sub-categories that are the the same in both data sources
The goal of this filter is to remove any product sub-category that joins to a product sub-category with the same name. To do this, I created a simple boolean calculation, then added it to the Filters shelf and selected False.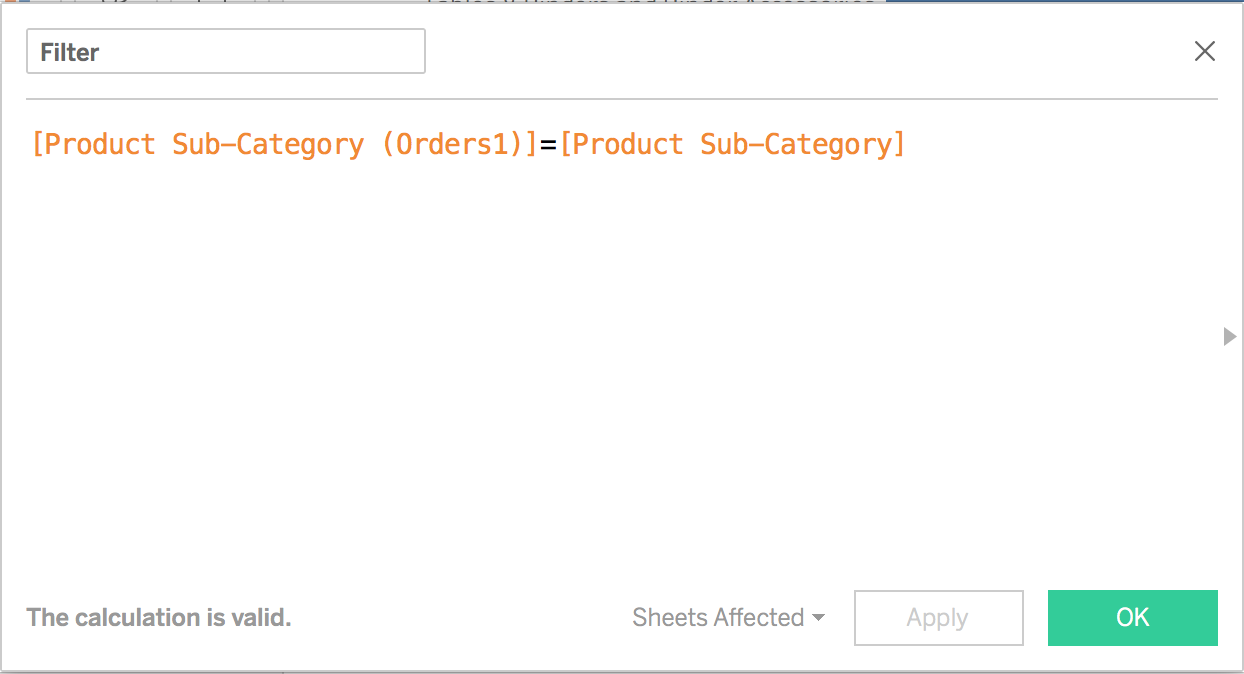
STEP 3: Create a Total Sales calculation
This is pretty straight forward. Simply take the two sales measures and add them together.

STEP 4: Combine the sub-categories to get a list of the products that sold together
You could do this with a combined field, I merely prefer to write the calculation.

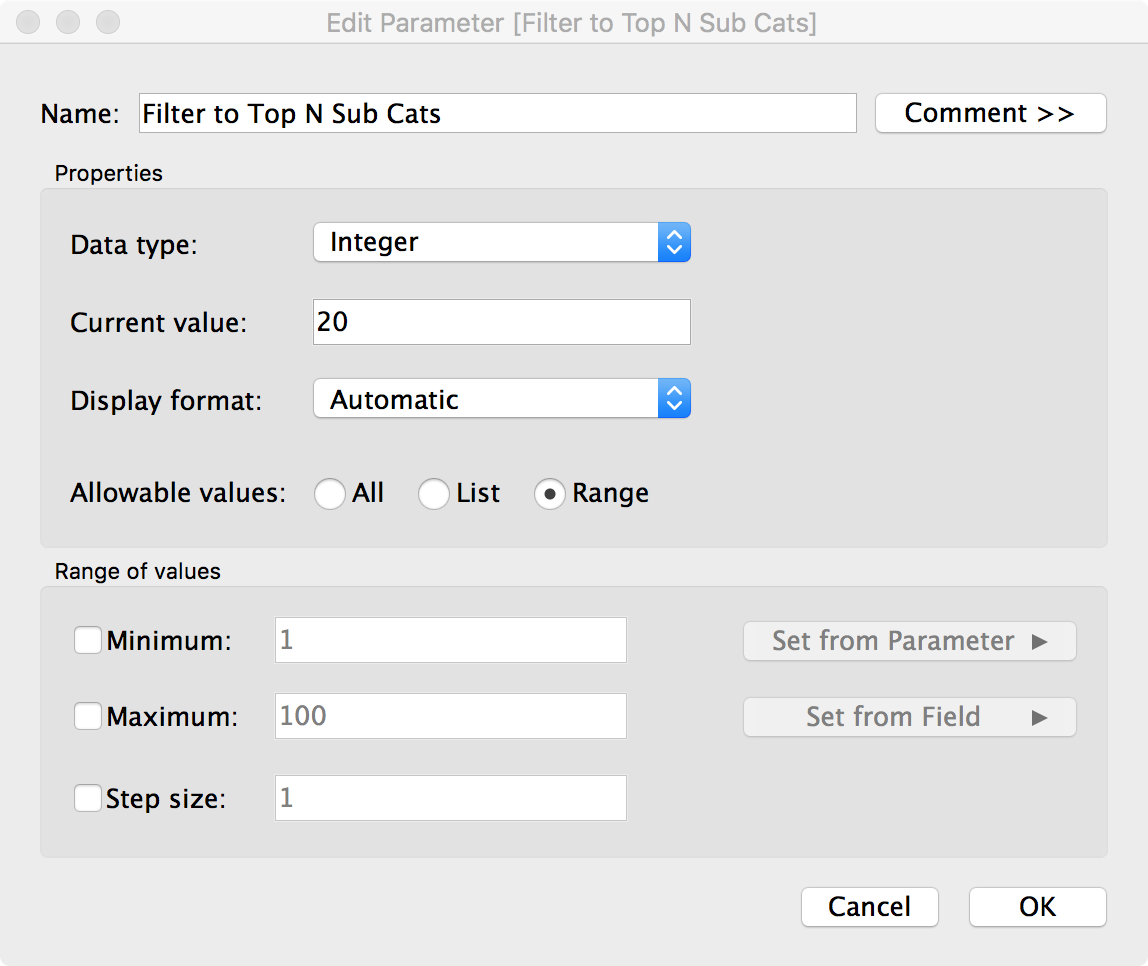
STEP 5: Create the Top N parameter and show the parameter control
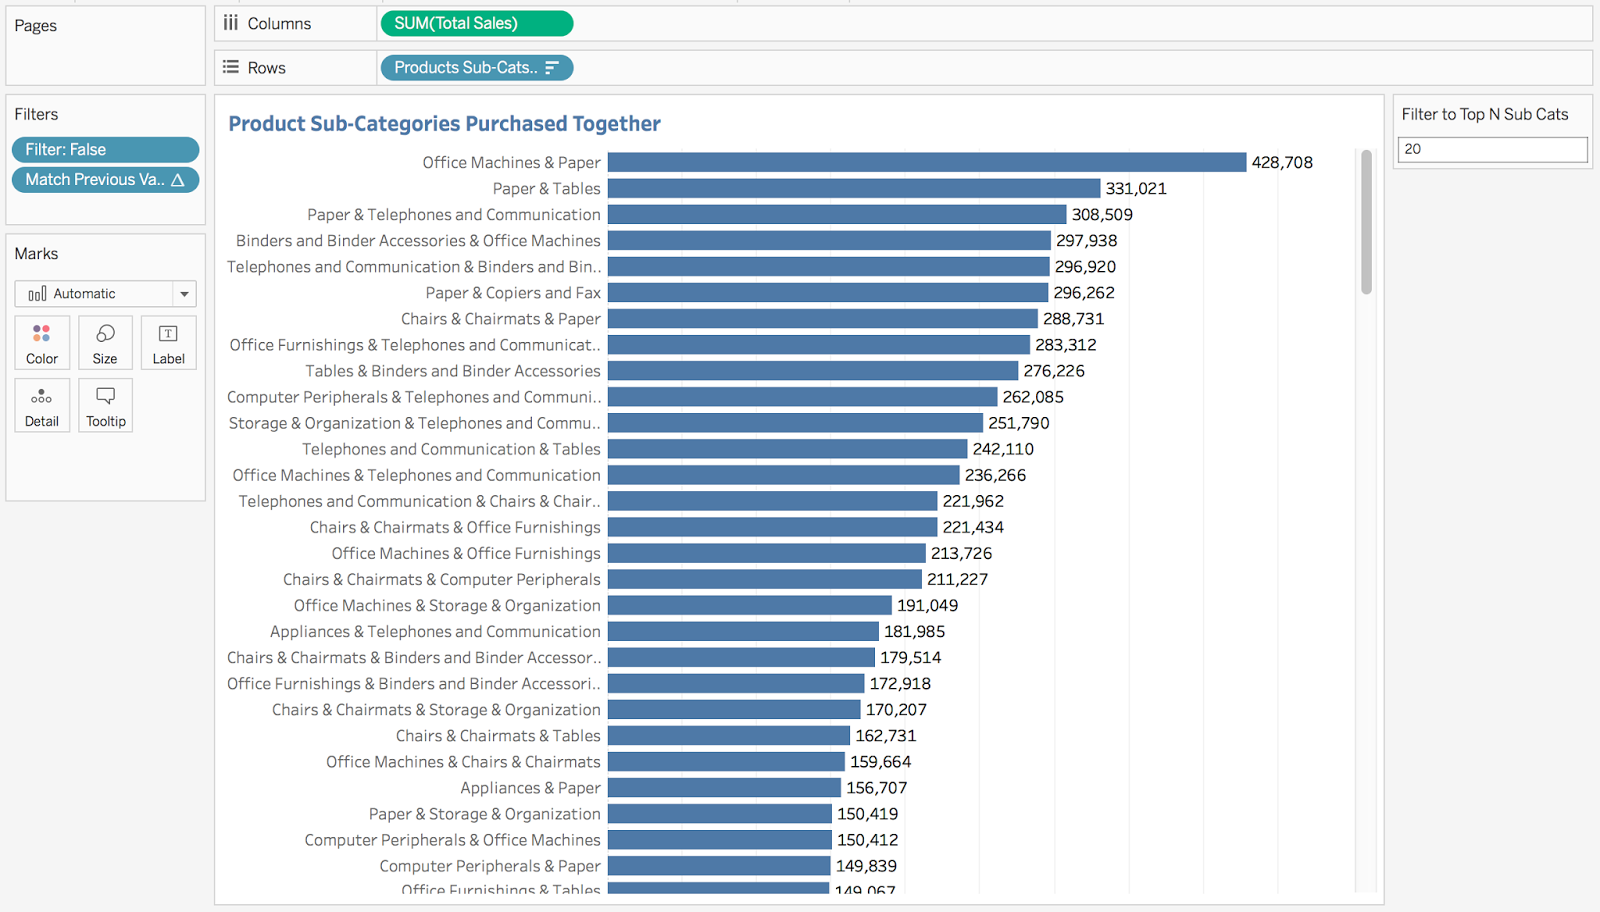
STEP 6: Build a bar chart of the sub-categories purchased together sorted by Total Sales

Notice that I now have every combination of product sub-categories purchased together duplicated. I'll need a couple table calcs to fix this.
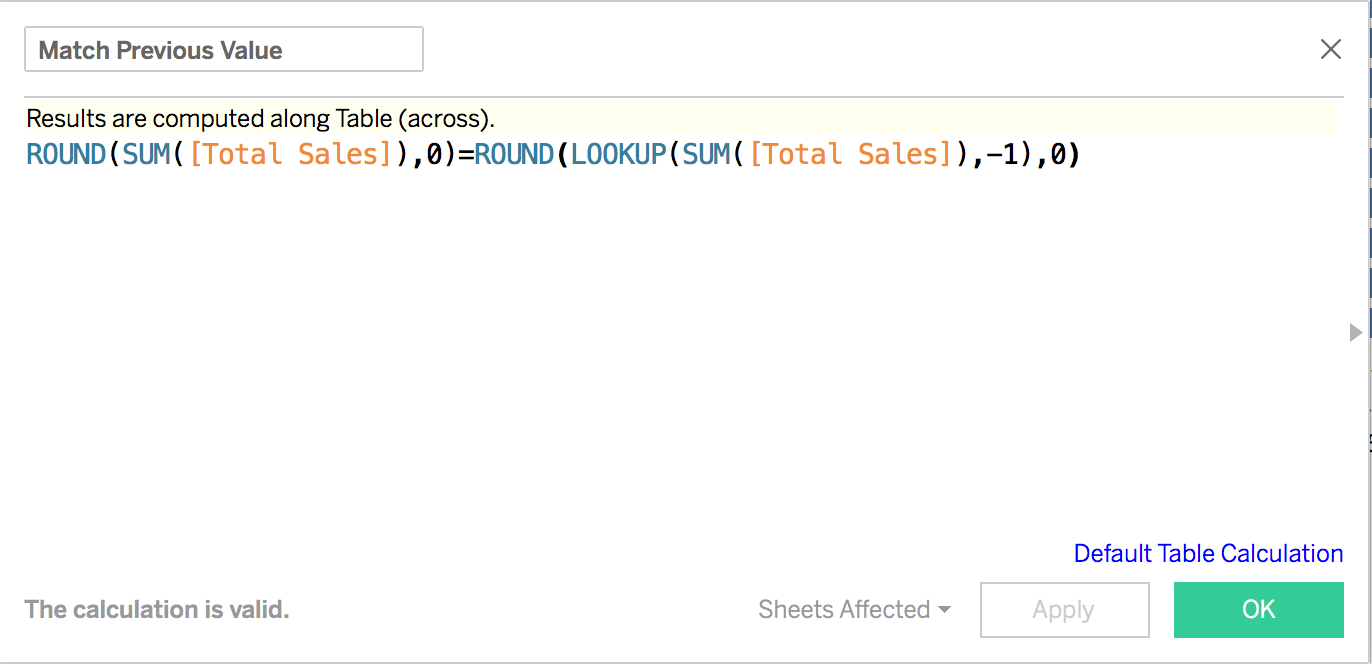
STEP 7: Check if the current row matches the previous row
With this calculation, I'm checking for duplicates. If I get "True" back as a result, then that means it's a duplicate. Notice here that I'm rounding the sales. I had to do this because Tableau wasn't matching the sales for some reason.
By excluding the "True" results with a table calc filter, I now have removed the duplicates.
STEP 8: Filter to the top N sub-categories
Again, I need a table calc filter. I need to rank the total sales, but since I have twice as many records (the previous table calc filter essentially just "hides" the other rows), I need to take twice as many rows as I indicate in the parameter.
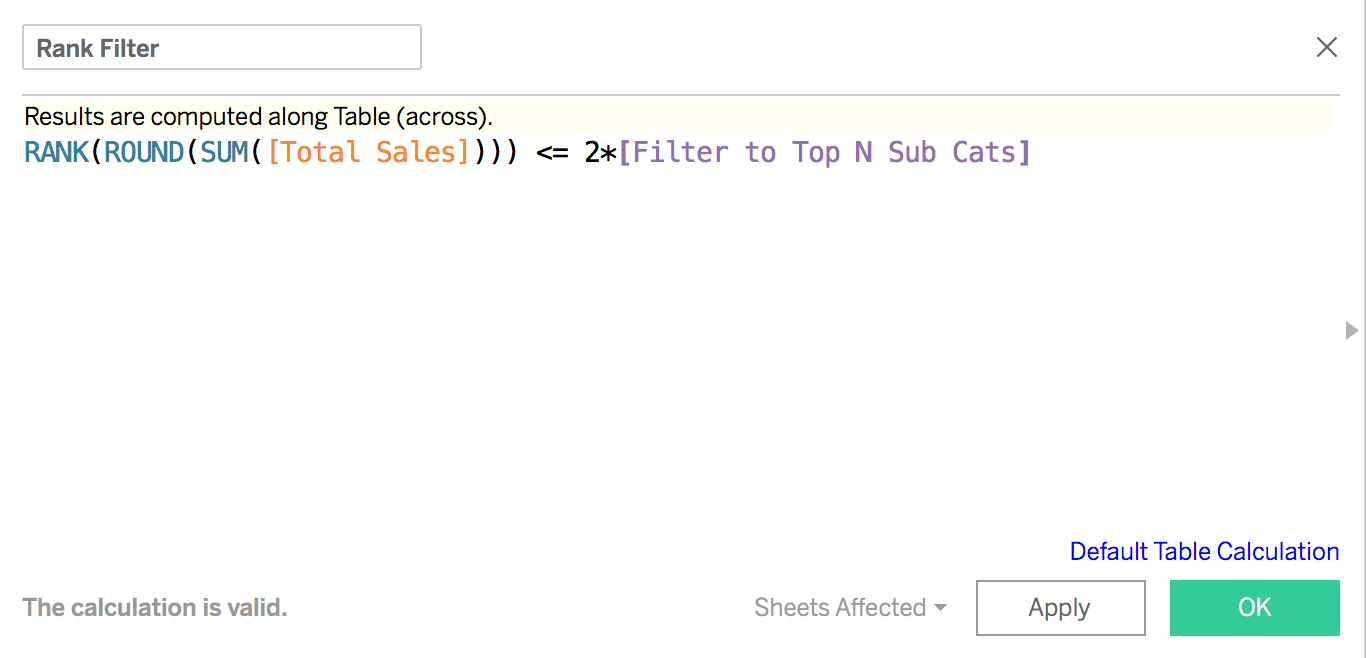
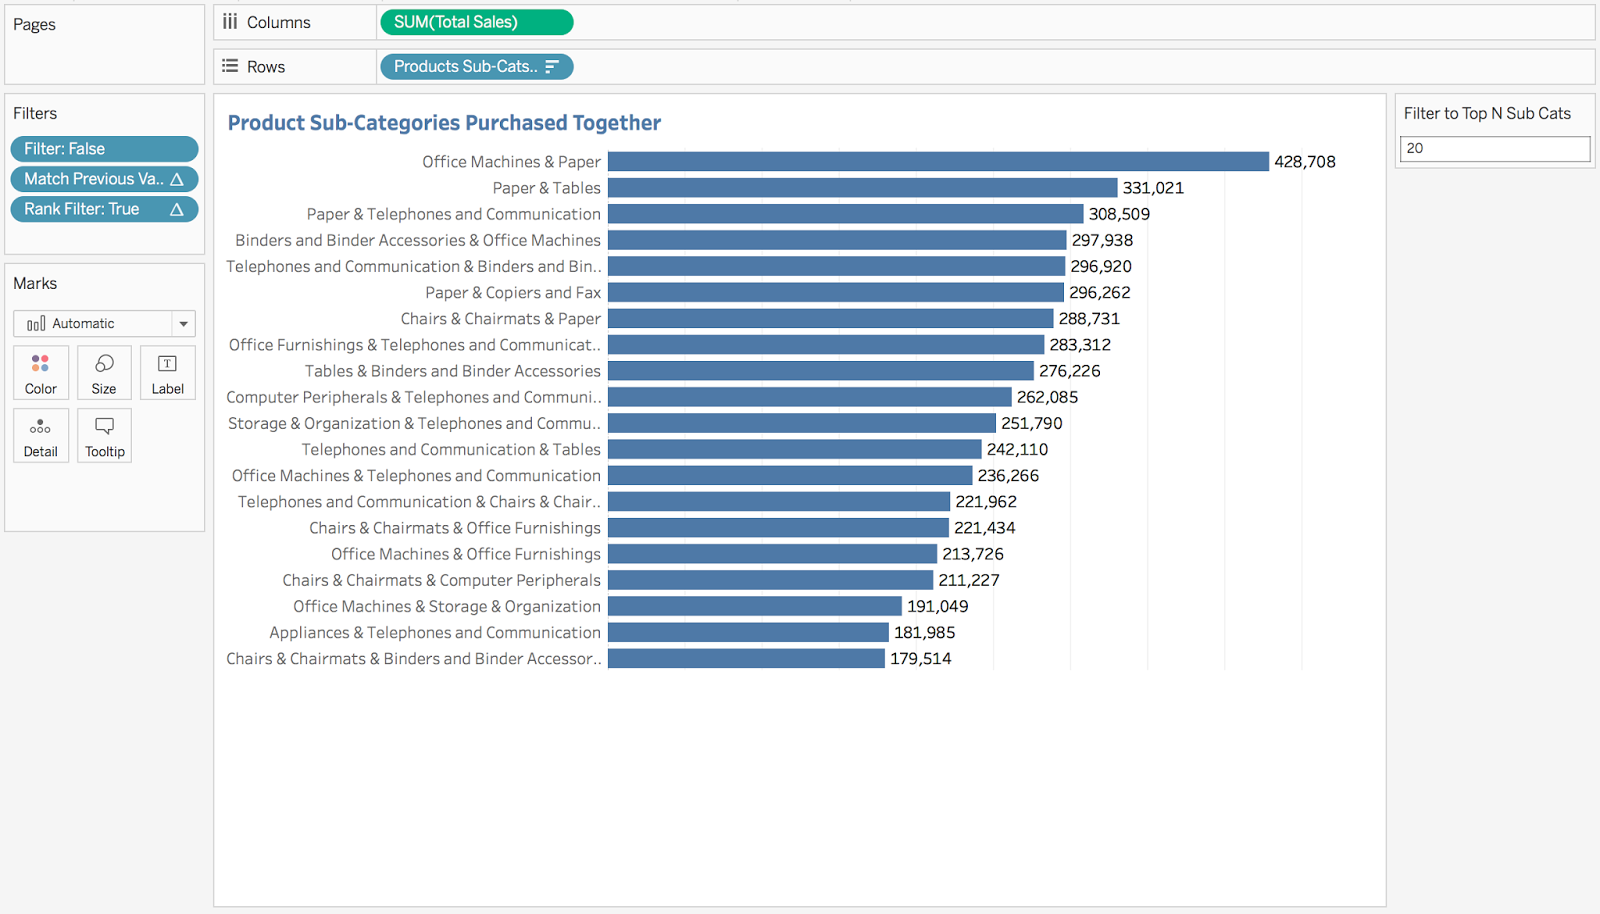
Drag this calc to the Filters shelf and choose True and I have the results I want.
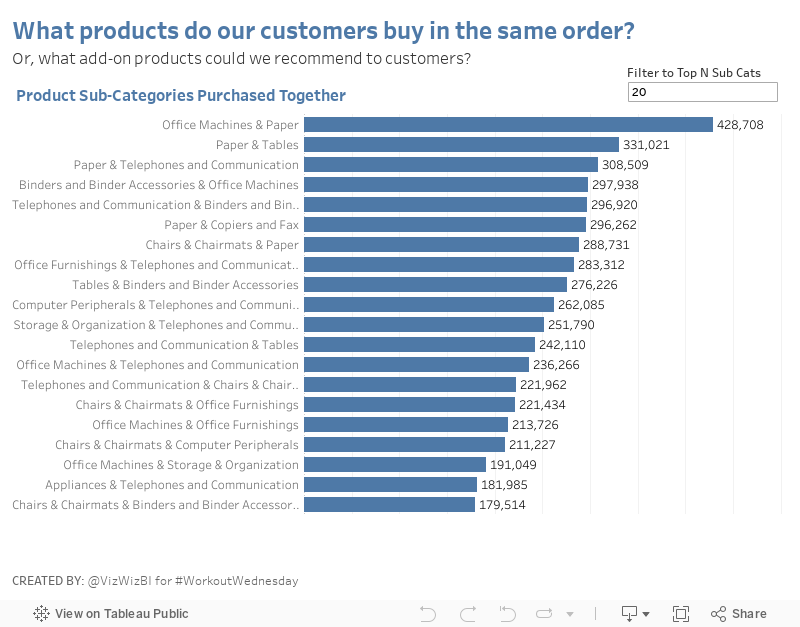
STEP 9: Build the final dashboard
Subscribe to:
Post Comments
(
Atom
)


Nice job! Maybe put it in a dashboard with heat map matrix at top with highlight actions between both charts?
ReplyDeleteGo for it! That wasn’t the challenge posed though.
DeleteHi Andy,
ReplyDeleteGreat article, may be you can also try all records in x-axis from one data-set and others in y-axis from other data-set. I tried it a couple of months ago and it give a great approach to data. I am unable to upload any JPEG here :( otherwise shared the snapshot
To get rid of the duplicates, I used INDEX()<=2*TopN rather than RANK(). It works, but I'm always curious about application outside of this specific example. Are there any issues with using INDEX rather than RANK?
ReplyDeleteIndex is a counter. It’s the same as Rank_Dense not Rank.
DeleteAndy,
ReplyDeleteHow would you suggest going about finding counts for more than two subcategories? For example, how many orders were there for Paper and Tables and Copiers and Chairs?
Not sure, see if you can figure it out.
DeleteI've been looking into this for longer than I care to admit.. So far my lines of though are along creating two separate Sets (1.Paper & Tables - 2.Copiers & Chairs) and then making a set of those two sets. The 'IN' of that set should give the count of order id's that have all four of the items.
DeleteThanks for your response - reading your blog has taught me so much.