April 11, 2018
Workout Wednesday Part 1: Top 5 Subcategories with the Most Products
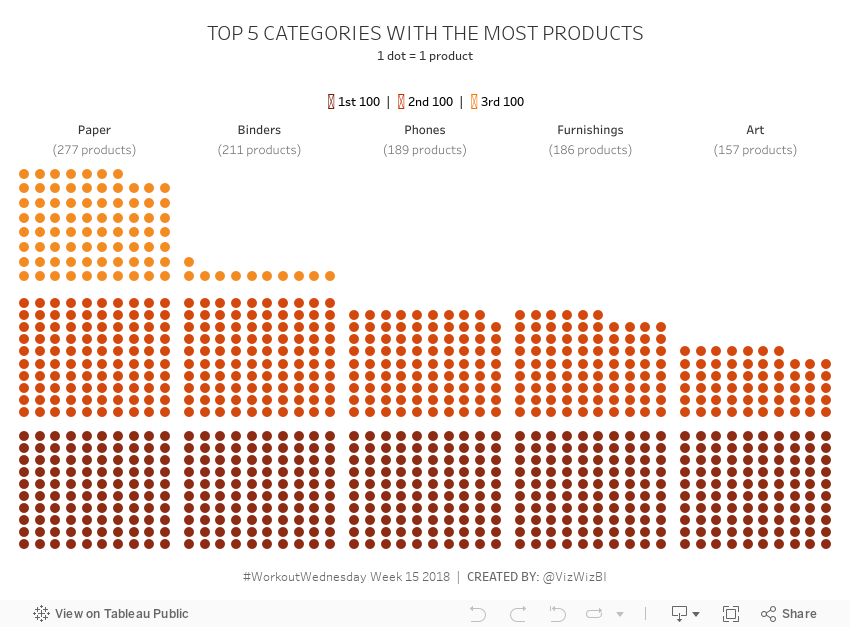
Luke is back and he has posted two challenges this week. First, create a pictogram of the top 5 subcategories that have sold the most products. They should be represented in 100 dot sections and colored depending on the section they are in. Get the requirements here.There were two requires that I didn't need to use to make it work:
- Set the minimum and maximum values on the columns axis (x-axis) to -3 and 12, respectively.
- Set the minimum and maximum values on the rows axis (y-axis) to -1 and 32, respectively.
I'm not sure what the purpose of these would be, but I suspect it's some sort of spacing. I didn't need them, so I ignored these requirements. Here's my version and now I'll get to work on part 2.
Subscribe to:
Post Comments
(
Atom
)


No comments
Post a Comment