October 22, 2018
Makeover Monday: Historical Major League Baseball Beer Prices
baseball
,
beer
,
highlight
,
major league baseball
,
Makeover Monday
,
MLB
,
small multiples
,
team marketing report
No comments

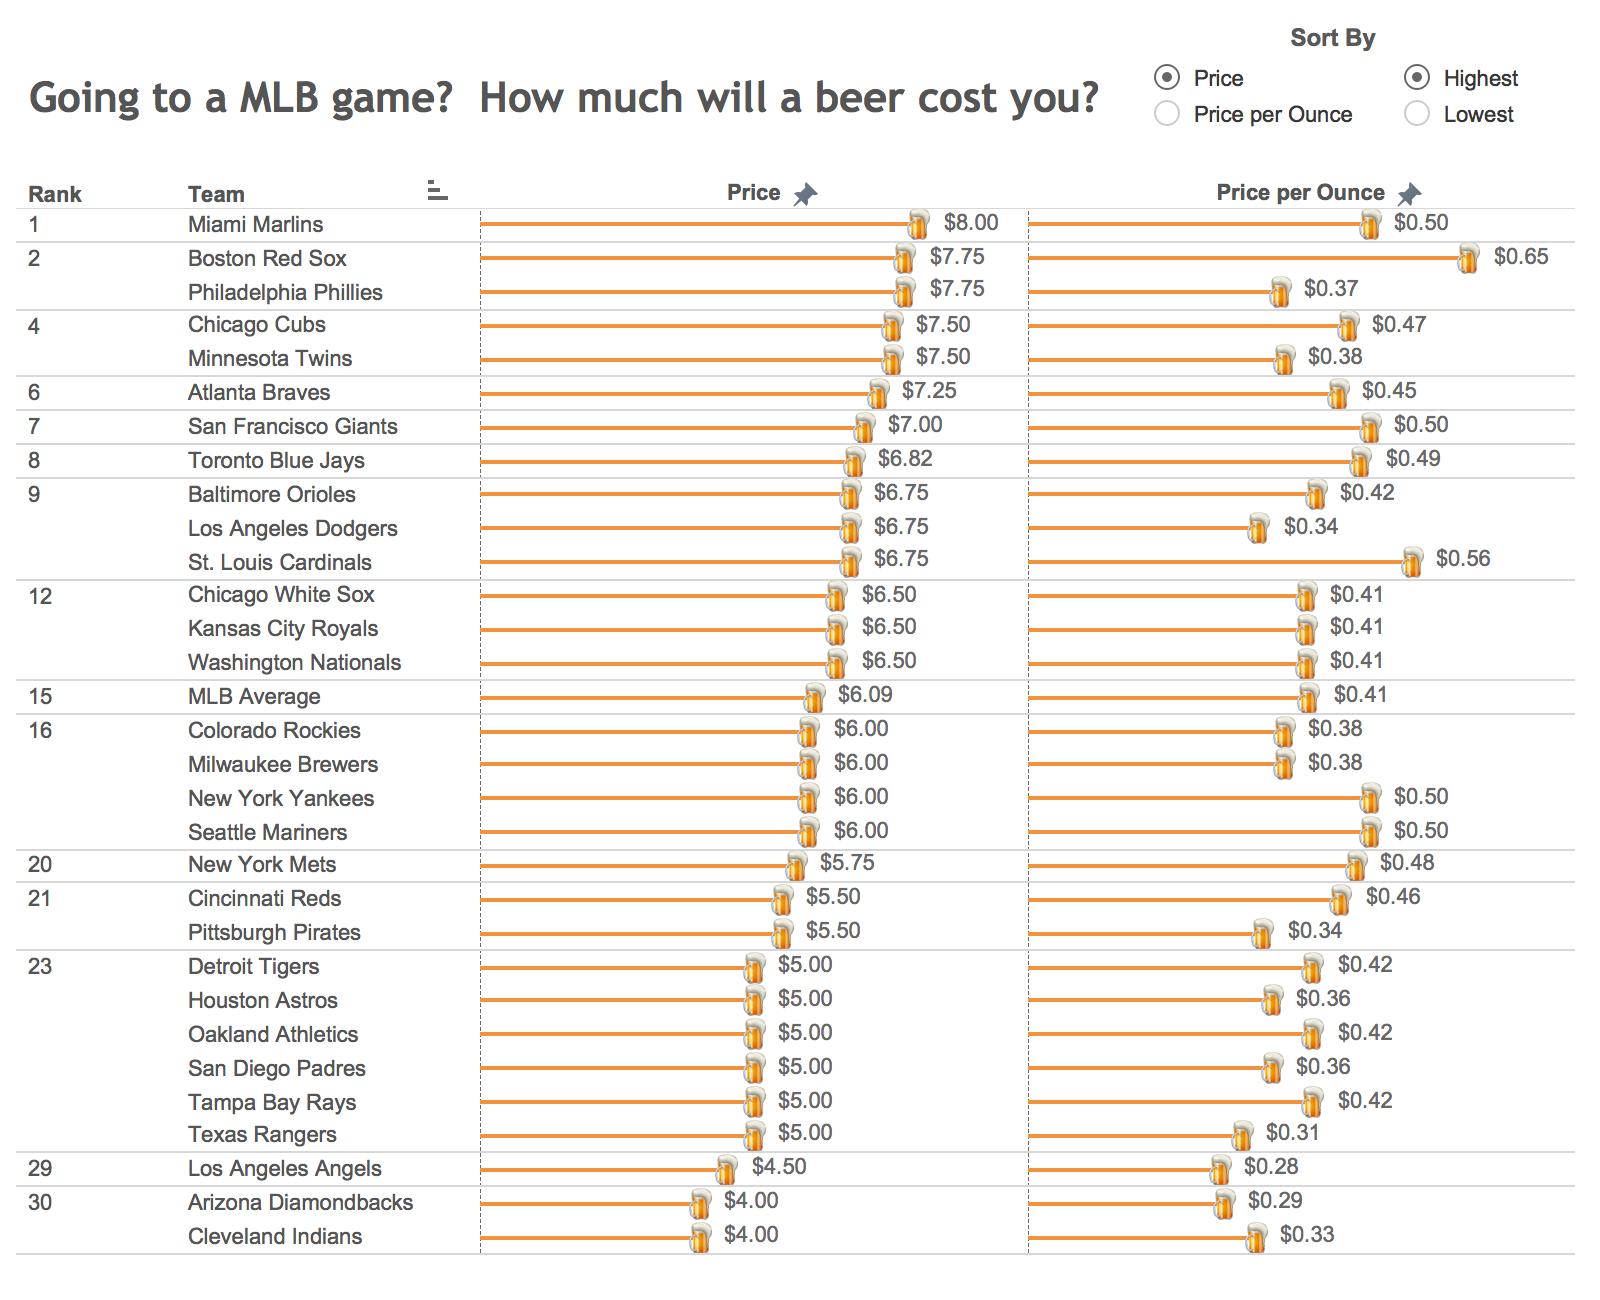
What works well?
- The title is clear and tells the reader what the data is about.
- The user can sort the data based on their preference.
- The placement of the sort options encourages interaction.
- The rank helps show where a team falls amongst the league.
- The color of the bars goes with the beer theme.
What could be improved?
- The data source is not listed.
- Having so labels on the end of every bar makes the viz too busy.
- The beer mug icons are completely unnecessary.
- The font looks very small.
What did I do?
- The new data set has data for 2013-2018 (except 2017), so I wanted to make sure I looked at the data over time.
- Made the title more descriptive so that the user (hopefully) understands what the line represents.
- I borrowed several techniques I learned from Workout Wednesday week 41:
- Shading those that have increased prices vs. 2013 with a red background
- Labeling the top middle with the team and the latest price
- Labeling the end of each line; in WW the labels were all placed on the lower-right of each pane, but I didn't like how it looked in this case
- Ordered the teams from highest to lowest based on the latest price
- Organized the team in a trellis format so they fit nicely into a 6x5 grid
- Included the data source. my name, and the inspiration for the design
And here's my Makeover Monday week 41. Click on the image for the interactive version. I can't wait to see what everyone creates at MM Live!
Subscribe to:
Post Comments
(
Atom
)


No comments
Post a Comment