Showing posts with label major league baseball. Show all posts
October 31, 2018
Analyzing Pitcher Performance With Density Heatmaps
baseballsavant
,
clayton kershaw
,
density
,
heatmap
,
justin verlander
,
major league baseball
,
MLB
No comments
With Tableau 2018.3 comes density heatmaps, a feature I've been playing with quite a bit and love it for when I have a dense concentration of points and a regular scatterplot doesn't work well. Transparency can help with dense dots, but I think the heatmaps work much better.
To give it a test, I downloaded every pitch for Clayton Kershaw and Justin Verlander (two of the best pitchers in Major League Baseball) from 2008-2018 from the great stats website Baseball Savant. Every time I look at baseball data, I'm amazed at the detail of the stats covered; the data far exceeds anything that is covered in other sports.
After downloading the data, I built the small multiples view below for each pitcher so that I could see their progression through the years. Click on the images for the interactive versions. I love how the data shows me how each pitcher has gotten better with their "misses" through their careers. For example, when they throw sliders for balls, they now tend to miss below the strike zone. This is a great sign that they have command of their pitches and are less likely to miss in an area where the batter can take advantage.
The density heatmap feature will most likely be used by most people on maps, which makes sense, but consider looking at it as an alternative whenever you need to plot x/y coordinates and have lots of points to display.


To give it a test, I downloaded every pitch for Clayton Kershaw and Justin Verlander (two of the best pitchers in Major League Baseball) from 2008-2018 from the great stats website Baseball Savant. Every time I look at baseball data, I'm amazed at the detail of the stats covered; the data far exceeds anything that is covered in other sports.
After downloading the data, I built the small multiples view below for each pitcher so that I could see their progression through the years. Click on the images for the interactive versions. I love how the data shows me how each pitcher has gotten better with their "misses" through their careers. For example, when they throw sliders for balls, they now tend to miss below the strike zone. This is a great sign that they have command of their pitches and are less likely to miss in an area where the batter can take advantage.
The density heatmap feature will most likely be used by most people on maps, which makes sense, but consider looking at it as an alternative whenever you need to plot x/y coordinates and have lots of points to display.
October 22, 2018
Makeover Monday: Historical Major League Baseball Beer Prices
baseball
,
beer
,
highlight
,
major league baseball
,
Makeover Monday
,
MLB
,
small multiples
,
team marketing report
No comments

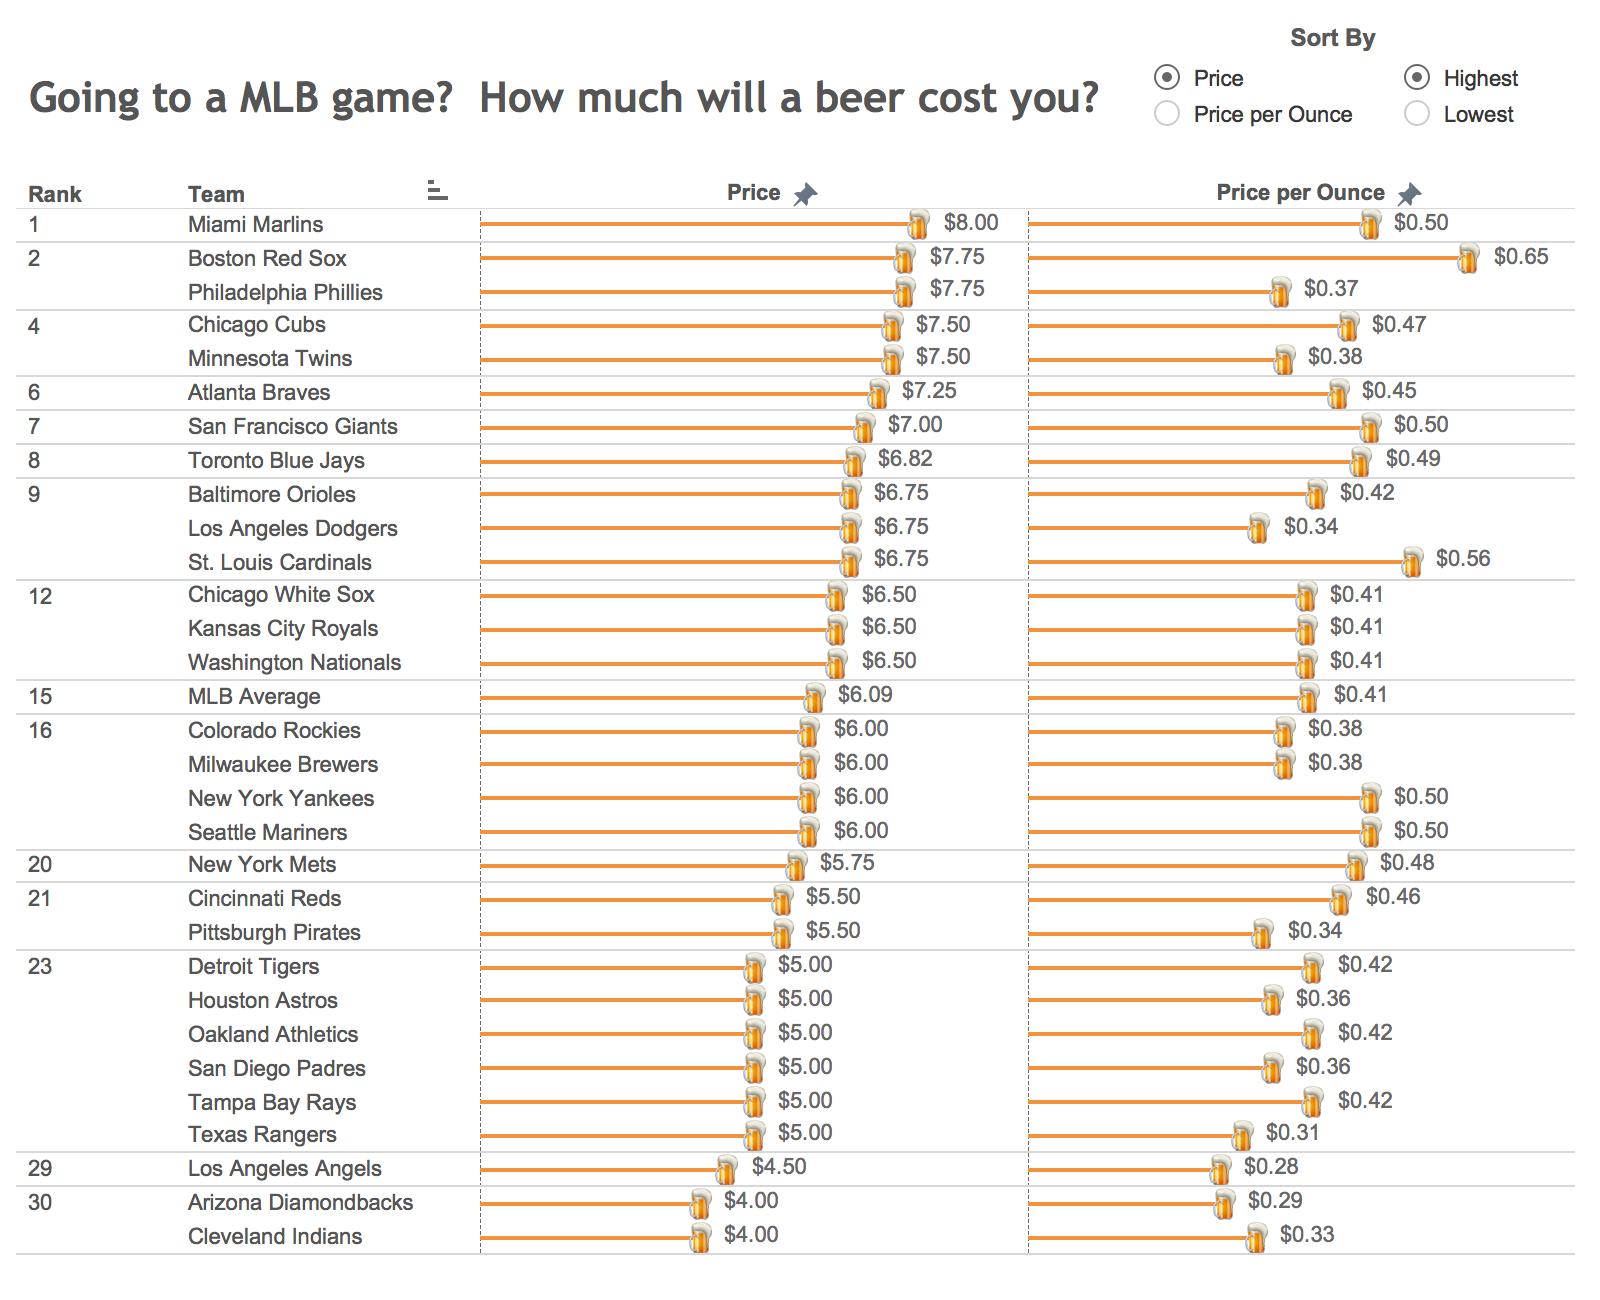
What works well?
- The title is clear and tells the reader what the data is about.
- The user can sort the data based on their preference.
- The placement of the sort options encourages interaction.
- The rank helps show where a team falls amongst the league.
- The color of the bars goes with the beer theme.
What could be improved?
- The data source is not listed.
- Having so labels on the end of every bar makes the viz too busy.
- The beer mug icons are completely unnecessary.
- The font looks very small.
What did I do?
- The new data set has data for 2013-2018 (except 2017), so I wanted to make sure I looked at the data over time.
- Made the title more descriptive so that the user (hopefully) understands what the line represents.
- I borrowed several techniques I learned from Workout Wednesday week 41:
- Shading those that have increased prices vs. 2013 with a red background
- Labeling the top middle with the team and the latest price
- Labeling the end of each line; in WW the labels were all placed on the lower-right of each pane, but I didn't like how it looked in this case
- Ordered the teams from highest to lowest based on the latest price
- Organized the team in a trellis format so they fit nicely into a 6x5 grid
- Included the data source. my name, and the inspiration for the design
And here's my Makeover Monday week 41. Click on the image for the interactive version. I can't wait to see what everyone creates at MM Live!
September 13, 2018
Clayton Kershaw & My Learning Process
baseball
,
baseballsavant
,
clayton kershaw
,
density
,
heatmap
,
learning
,
major league baseball
,
pitcher
,
process
,
spatial
No comments
What is Learning?
According to UC Berkley, learning is a process that:
- is active - process of engaging and manipulating objects, experiences, and conversations in order to build mental models of the world (Dewey, 1938; Piaget, 1964; Vygotsky, 1986). Learners build knowledge as they explore the world around them, observe and interact with phenomena, converse and engage with others, and make connections between new ideas and prior understandings.
- builds on prior knowledge - and involves enriching, building on, and changing existing understanding, where “one’s knowledge base is a scaffold that supports the construction of all future learning” (Alexander, 1996, p. 89).
- is situated in an authentic context - provides learners with the opportunity to engage with specific ideas and concepts on a need-to-know or want-to-know basis (Greeno, 2006; Kolodner, 2006).
- requires learners’ motivation and cognitive engagement to be sustained when learning complex ideas, because considerable mental effort and persistence are necessary.
I've left a couple bits out that aren't relevant to learning in the context of data visualization, but all of the others should resonate with you if you approach learning with the correct mindset.
As an example, I am actively look for reasons to practice features in the Tableau 2018.3 beta, especially around density mapping. I was reading an article this morning about Clayton Kershaw, whom many consider the best pitcher in Major League Baseball. He also has highest base salary at $33M for 2018.
Most of the density maps I've seen have had a mapping component. In the case of baseball, and pitching in particular, the spatial zone is the strike zone. Data is easily accessible to get the coordinates of every pitch as it crosses home plate.
For this project, the learning process:
- is active in that I am building my knowledge as I explore the data set and learn the new features.
- builds on my prior knowledge of how the feature works and my knowledge of the game of baseball. However, I had never done a scatterplot of pitching before, so I had to learn new terminology in the data. This knowledge will help me be more productive and learn faster in the future.
- is situated in the authentic context of engaging with the ideas and visual concepts that I saw online and drew on paper.
- required my motivation and engagement to see the project through to fruition and the persistent to make the display visually accurate.
I hope my thought process helps you focus your learning. I love helping people get better at what they do and if I can help you speed up your learning, then we'll all be better for it.
With that in mind, here are two images I created for this project. The first is all pitches by Kershaw and the second is of his curveballs, which is known to be his most potent pitch. Once Tableau Public supports Tableau 2018.3, I'll publish them and include links on the images.


February 5, 2018
Makeover Monday: Did the rise of Latino players signal the decline of African American players?
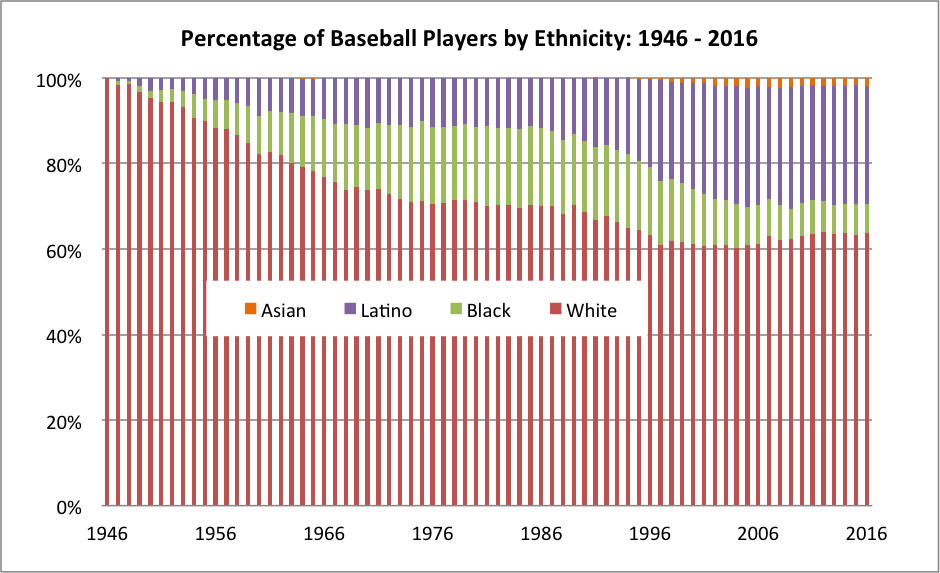
What works well?
- The x-axis is labeled every 10 years starting with the first year in the data set. This works well since there are 70 years in the data set.
- Labeling the y-axis for every 20% keeps that axis from getting too cluttered.
- The title is straight to the point.
- Placing the legend in the middle of the graph allows the chart to use the entire space.
- Stacking "White" on the bottom is a good choice since it's always the largest segment.
What could be improved?
- As it's stacked bars, it's harder than necessary to determine the percentage that Black and Latino comprise since their position is influenced by the colors below them.
- The bars appear to be of differing widths and that makes it look a bit blurry to me.
- An area chart would be much easier to understand.
- Consider more distinct color choices, particularly for White and Black.
- The visualization doesn't flow well with the accompanying story, which was about the increase in blacks and the more recent decrease. There's no indicator to the audience that this is what the chart is about.
What did I do?
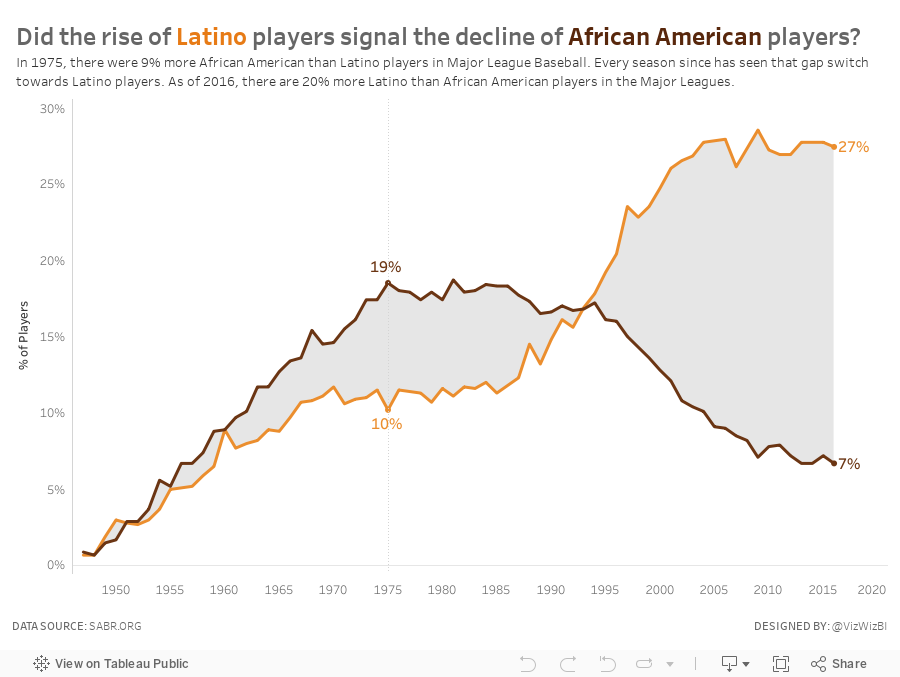
I started by exploring the data and looking for a more interesting story. Was there a reason or cause for the recent decline of blacks in MLB? Is this the same for other minorities? How does WAR come into play, if at all? All of these questions are super simple to answer with Tableau's ability to support the way your brain thinks.
In the end, the most interesting story I found was the relationship between the decline of African Americans plays and the rise of Latino players. So my viz focusses on that.
Subscribe to:
Posts
(
Atom
)






