October 4, 2018
Workout Wednesday: Where are Sub-Category Sales Down?
alert
,
formatting
,
indicator
,
KPI
,
modulo
,
padding
,
table
,
table calc
,
Workout Wednesday
No comments
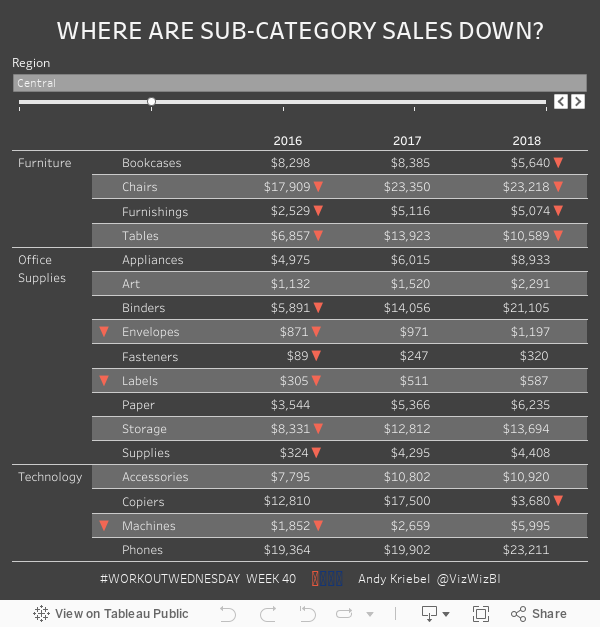
Three weeks in a row now! Feels like I'm on a roll. This week, Luke challenged use to create an actionable table which alerts users to the problem areas very quickly. This is a neat way to get people to begin the journey from Excel tables to interactive visualizations.Read all of the requirements here.
Some thoughts:
- I had used a lot of the tricks before, so I had an idea where to start. This video should be helpful for the indicators.
- I ended up using the modulo function along with an INDEX table calc to find the odd and even numbered rows so that I could format all of the text correctly.
- Getting the year to align correctly with the numbers was the toughest part. I could tell by looking at the viz that the text was centered, yet it was made to look like it was right-aligned. Therefore, I had to come up with a solution for padding the text on the left for smaller numbers. I won't give away how I did it.
Really good challenge. I particularly enjoy the workouts that have practical use cases for every day work. Thanks Luke for the challenge!

Subscribe to:
Post Comments
(
Atom
)


No comments
Post a Comment