Showing posts with label alert. Show all posts
August 11, 2022
10 Methods for Displaying Variance with Bar Charts
alert
,
bar chart
,
bar in bar
,
bullet graph
,
context
,
deviation
,
diverging bar chart
,
floating bar chart
,
indicator
,
population pyramid
,
side by side bar
,
sparkbars
,
sparklines
,
tableau
,
tip
,
variance
No comments
Using variance as a measure in bar charts helps you:
- Add context - You can answer the question “compared to what?”
- Make decisions - You can answer the question "what should we do next?"
- Alert you to areas that need focus
In this video, I show you 10 ways to add variance to bar charts. Get the workbook here.
October 4, 2018
Workout Wednesday: Where are Sub-Category Sales Down?
alert
,
formatting
,
indicator
,
KPI
,
modulo
,
padding
,
table
,
table calc
,
Workout Wednesday
No comments
Three weeks in a row now! Feels like I'm on a roll. This week, Luke challenged use to create an actionable table which alerts users to the problem areas very quickly. This is a neat way to get people to begin the journey from Excel tables to interactive visualizations.
Read all of the requirements here.
Some thoughts:
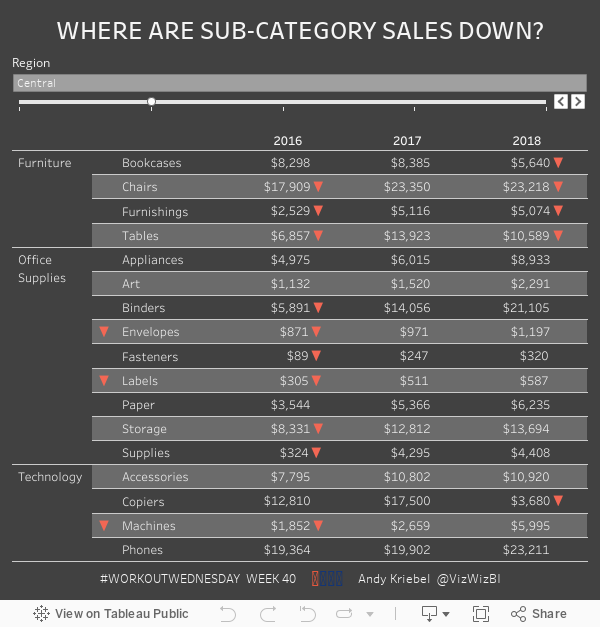

Read all of the requirements here.
Some thoughts:
- I had used a lot of the tricks before, so I had an idea where to start. This video should be helpful for the indicators.
- I ended up using the modulo function along with an INDEX table calc to find the odd and even numbered rows so that I could format all of the text correctly.
- Getting the year to align correctly with the numbers was the toughest part. I could tell by looking at the viz that the text was centered, yet it was made to look like it was right-aligned. Therefore, I had to come up with a solution for padding the text on the left for smaller numbers. I won't give away how I did it.
Really good challenge. I particularly enjoy the workouts that have practical use cases for every day work. Thanks Luke for the challenge!
June 21, 2016
Tableau Tip Tuesday: Using LOD Calcs for Year over Year Comparisons
alert
,
ascii
,
bullet graph
,
comparison
,
level of detail
,
LOD calc
,
Tableau Tip Tuesday
,
year over year
4 comments

For this week’s Tableau Tip Tuesday I show you how to use Level of Detail expressions to get the latest year and prior year and then compare then to create visual alerts.
April 26, 2016
Tableau Tip Tuesday: Create Alerts with ASCII Symbols

Quick tip this week on using ASCII symbols in calculations as indicators. This is useful for creating alerts similar to many of Stephen Few’s examples. This could easily be extended to arrows or triangles or any other ASCII shape you like.
Subscribe to:
Posts
(
Atom
)






