December 3, 2018
Workout Wednesday | Week 48: Profitability Bridge
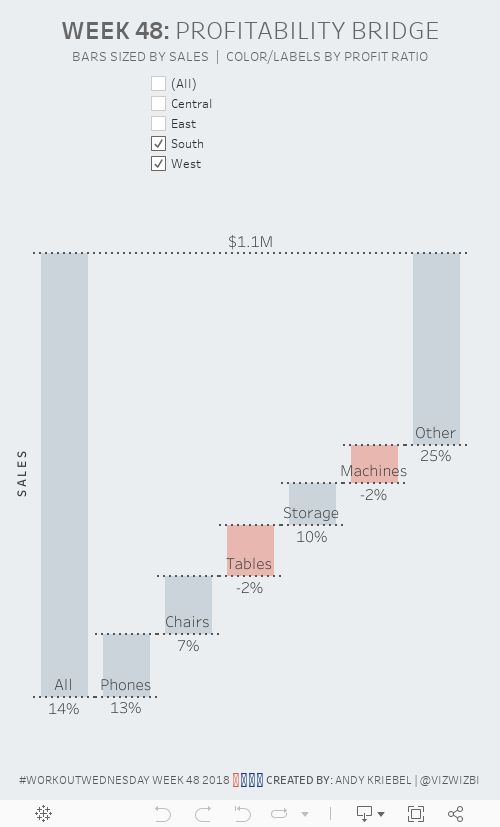
I'm a bit behind again on Workout Wednesday, you know, this whole life thing. Today I had a few minutes to look at week 48. As it was a waterfall chart with a couple of other tricks thrown in, I thought it would be pretty straightforward, and it was...thank goodness.The basic requirements:
- Create a waterfall chart showing the top 5 sub-categories by sales. Include an other category for all other categories.
- Show a bar on the far-left of the waterfall that shows all sub-categories. Label it all.
- Add dashed lines that “connect” each bar.
- Add a dashed line that connects the All bar with the Other bar.
- Make sure each line looks as a single continuous dashed line.
- Label each sub-category above the bottom line of each bar.
- Label each bar with the profit ratio below the bottom line of each bar.
- Add a filter by region. Make sure the filter is centered on the dashboard above the chart.
- Color the bar gray if it above zero or pink if it is below zero.

Subscribe to:
Post Comments
(
Atom
)


No comments
Post a Comment