January 9, 2023
#MakeoverMonday 2023 Week 2 - The Spartacus Gay Travel Index

I found the subject of this week's data set on the Instagram account of The Map Zone. It's a simple map of what's called the "Gay Travel Index".
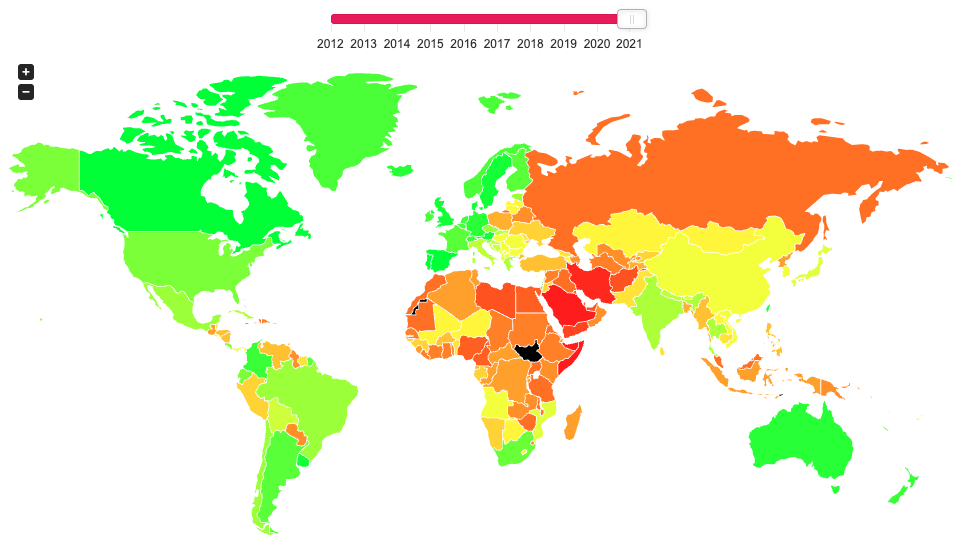
The annually updated SPARTACUS Gay Travel Index informs travellers about the situation of lesbians, gays, bisexuals and transgender (LGBT) in a total of 202 countries and regions. The US-Index provides information about each of the 50 federal states of the US.
The index attempts at finding a balance between measuring the rights of the local LGBT community and considering the demands of queer holidaymakers. Our aim is to monitor the safety of queer people in each country and also increase the awareness on grievances.
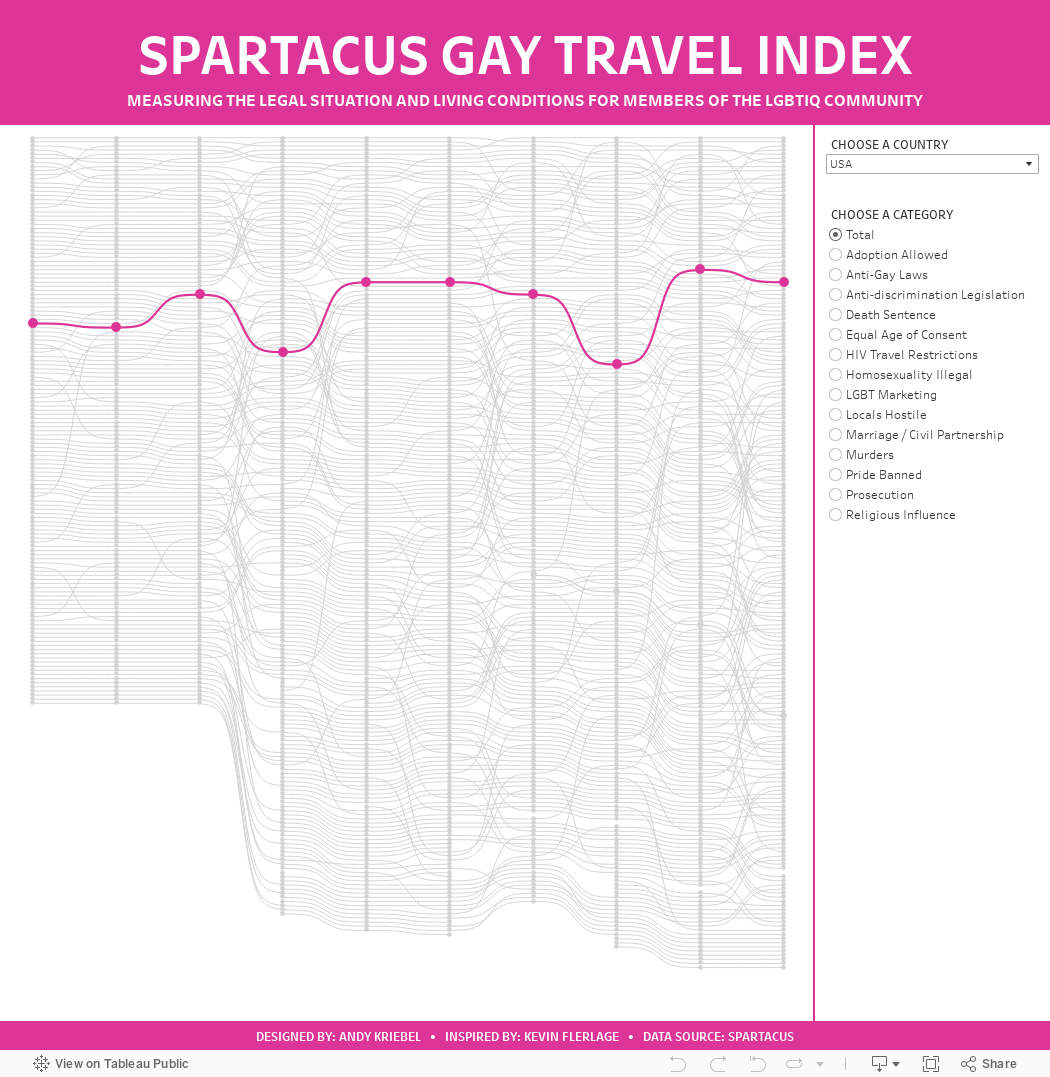
When I saw that the data was a ranking over time, I thought I'd give a curvy bump chart a try. I used this blog by Kevin Flerlage. He makes it super simple to follow along. During WatchMeViz, I showed how to use one of Kevin's visualizations from an old Makeover Monday as a template. I showed how to take the data we had for this week, transform it to the write shape needed for the template, then how to swap out the data source with the new one we created.
Honestly, when I swapped out the data sources, I was convinced that I would have messed things up along the way, but alas, I didn't and I was basically done. I spent time formatting, adding in more categories, and a bit more. Check out the viz below or here and follow along with Watch Me Viz to see how to build one yourself here.


No comments
Post a Comment