Showing posts with label Brian Bieber. Show all posts
August 25, 2014
Tableau Tip: Month over Month KPI Movers
Brian Bieber
,
calculated fields
,
change
,
KPI
,
last
,
lookup
,
monitor
,
parameters
,
table
,
tableau
,
tips
13 comments
Reader Brian Bieber (no relation to Justin), a Data Analyst at Vanguard, sent me this question:
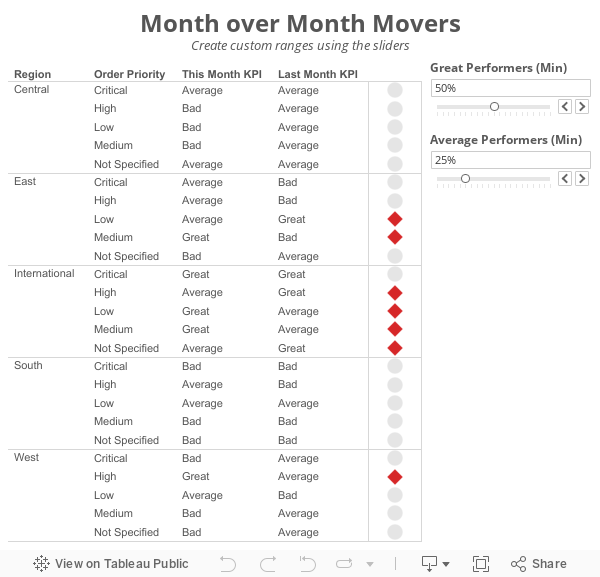 The steps for building a KPI movers viz like this are pretty straight forward. I'm using the Superstore Sales data set that comes with Tableau in this example.
Step 1: On a PC, right-click drag Order Date to the Columns shelf. On a Mac, Option+Drag Order Date. Choose the continuous month option.

Step 2: Right-click on the Order Date pill on the Columns shelf and change it to Discrete.

Step 3: Right-click on the Order Date field on the Column shelf and choose Show Missing Values. This is important because it turns on data densification. Months where data does not exist get displayed.

Step 4: Add the dimensions you would like to slice the data by to the Rows shelf. For this example, I've used Region and Order Priority.

Step 5: Create a calculated field called Last and change the Default Table Calculation to Order Date.


Step 6: Right-click on the Last field you just create in the Measures area of the Data window and choose Convert to Discrete.
Step 7: Drag the Last field to the Filters shelf and choose 0. This will change the view to only show the latest date.

Step 8: Create a calculated field to get the value for the most recent month. Notice that I'm using the LOOKUP function. Change the Default Table Calculation to Order Date.

Step 9: Create a calculated field to get the value for the previous month. The only difference here is we need to offset the LOOKUP by 1. Change the Default Table Calculation to Order Date.

Step 10: Create two parameters: one to determine the lower limit of the top KPI (Great Performers) and one to determine the lower limit of the middle KPI (Average Performers).


Step 11: Create the KPI calculations for the most recent month and the previous month. Notice that I'm using the parameters.


Step 12: It's up to you if you want to follow this step. For this specific example, I wanted to see the KPI for this month and last month in the table, so I've added them to the Rows shelf.

Step 13: Create a calculated field that returns a boolean to compare the values for this month to determine if they are a "Mover". I'm using Brian's definition for this example.

Step 14: Drag the Movers field to the Color shelf. I chose to set the colors to a light gray when True and red when False. This way only the Movers stand out.

Step 15: Optional - Change the Marks type to Shape and drag Movers to the Shape shelf as well, then pick shapes that give the affect your looking for. I chose diamonds for the Movers and circles for everything else.

Lastly I did a few cleanup items before placing the worksheet on the dashboard you see at the top of this post:

This method could easily be changed to accommodate many different scenarios like day over day, week over week or year over year.
Download the sample workbook here.
I'm currently running some monthly data where a list of records is assigned a KPI indicator like G/Y/R. I've been asked to produce a follow-up piece that would show "movers" from the prior month's data, just in a simple text view. So I guess what I need to try and do is figure out how to do a lookback/compare from prior month data to see who went from Y/R to G on the positive change side and who went from G to Y/R on the negative side.What Brian didn't realize was that answer to his question was pretty much in the question itself; he needs to use to LOOKUP() function. I sent Brian a solution, but decided to fancy it up a bit more and add some more functionality using parameters:
Step 1: On a PC, right-click drag Order Date to the Columns shelf. On a Mac, Option+Drag Order Date. Choose the continuous month option.
Step 2: Right-click on the Order Date pill on the Columns shelf and change it to Discrete.
Step 3: Right-click on the Order Date field on the Column shelf and choose Show Missing Values. This is important because it turns on data densification. Months where data does not exist get displayed.
Step 5: Create a calculated field called Last and change the Default Table Calculation to Order Date.
Step 6: Right-click on the Last field you just create in the Measures area of the Data window and choose Convert to Discrete.
Step 7: Drag the Last field to the Filters shelf and choose 0. This will change the view to only show the latest date.
Step 8: Create a calculated field to get the value for the most recent month. Notice that I'm using the LOOKUP function. Change the Default Table Calculation to Order Date.
Step 9: Create a calculated field to get the value for the previous month. The only difference here is we need to offset the LOOKUP by 1. Change the Default Table Calculation to Order Date.
Step 10: Create two parameters: one to determine the lower limit of the top KPI (Great Performers) and one to determine the lower limit of the middle KPI (Average Performers).
Step 11: Create the KPI calculations for the most recent month and the previous month. Notice that I'm using the parameters.
Step 13: Create a calculated field that returns a boolean to compare the values for this month to determine if they are a "Mover". I'm using Brian's definition for this example.
Step 14: Drag the Movers field to the Color shelf. I chose to set the colors to a light gray when True and red when False. This way only the Movers stand out.
Step 15: Optional - Change the Marks type to Shape and drag Movers to the Shape shelf as well, then pick shapes that give the affect your looking for. I chose diamonds for the Movers and circles for everything else.
Lastly I did a few cleanup items before placing the worksheet on the dashboard you see at the top of this post:
- Moved Order Date to the Detail shelf
- Reduced the level of the row divider
- Removed the bold text from Region
- Added a calculated field to the Filters shelf that checks that the value in the Great Performers parameter is larger than the value in the Average Performers parameter.
This method could easily be changed to accommodate many different scenarios like day over day, week over week or year over year.
Download the sample workbook here.
Subscribe to:
Posts
(
Atom
)






