Showing posts with label TV. Show all posts
February 26, 2020
Visualizing the Geography of TV Stations
contour
,
Erin Davis
,
FCC
,
frequency
,
geography
,
map
,
parameter
,
region
,
signal
,
TV
,
United States
,
USA
No comments

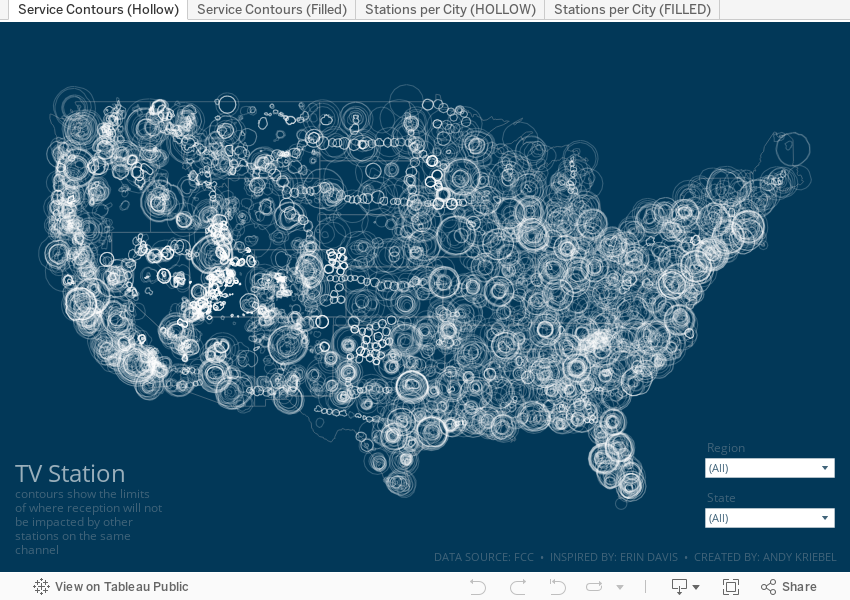
The piece I wanted to replicate in Tableau is based on her beautiful work Visualizing the Geography of FM Radio. Since she had already done this for radio, I thought I'd try to replicate her work, but with TV stations, that is, the strength and coverage that the broadcast signals from TV stations transmit.
First, I had to prep the data. Fortunately the raw data was easily accessible on the FCC website as are explanations of the fields and how to use them. The FCC also have information about which States fall into which FCC regions. I manually grouped the States into their regions in Tableau (it would have needed to be manually created data anyway).
From there, it was some data prep to get the signal boundaries for each state, ensure they are in the correct State (e.g., some stations that were listed in California actually plotted in other States), then export as a TDE (Hyper files don't work well with polygons).
Here's the Alteryx workflow:

For Tableau, I created a custom color palette based on the color legend on Erin's vizzes, replicated her maps as close as possible, and that's it!
Enjoy!
August 13, 2018
Makeover Monday: How many episodes aired for each of Anthony Bourdain's shows?
Anthony Bourdain
,
Christine Zhang
,
documentary
,
line chart
,
Makeover Monday
,
reality tv
,
television
,
Travel Channel
,
TV
No comments

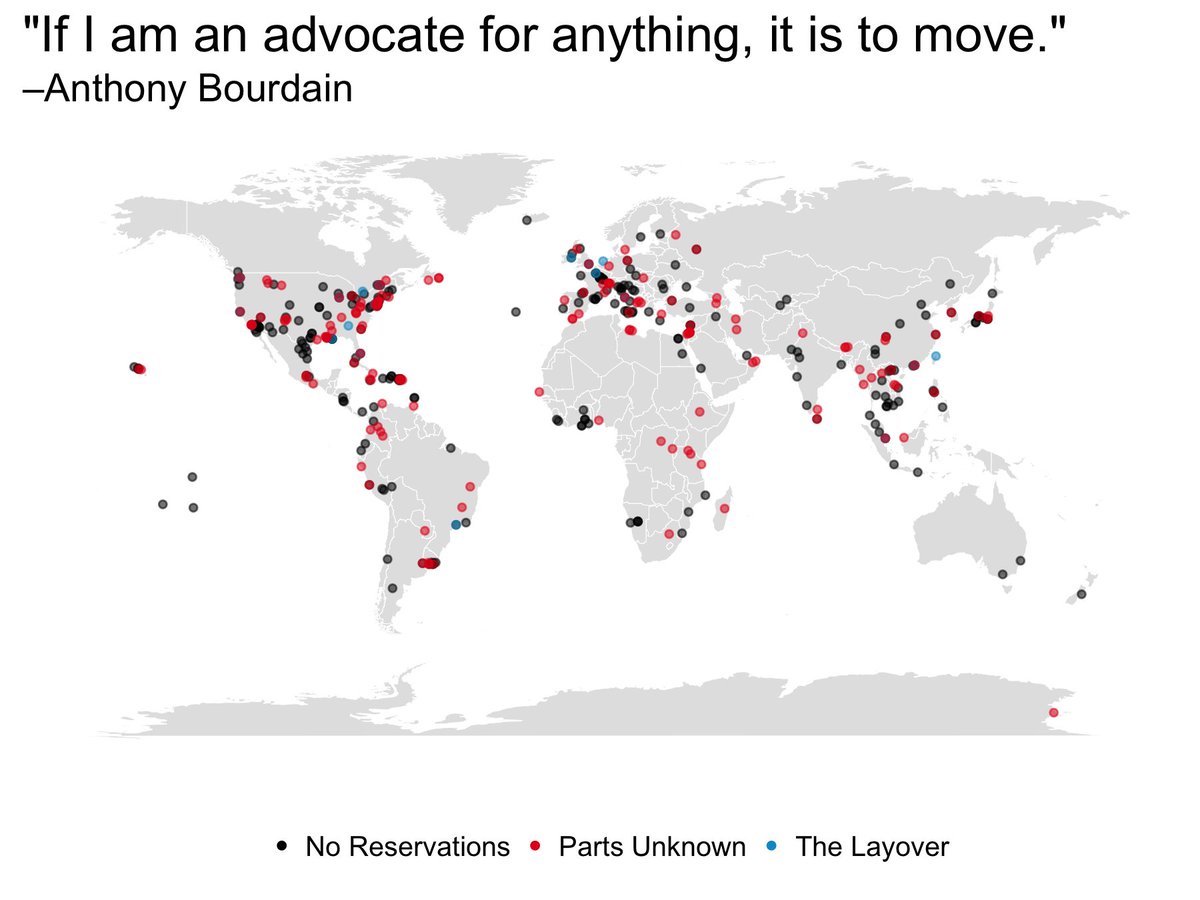
To celebrate his life, for Makeover Monday week 33, we're looking at data about all of his TV programs. The visualization to makeover comes to us from Christine Zhang:
What works well?
- The map makes the geographical breadth easy to understand.
- The colors are easy to distinguish.
- Using dots gives each location equal representation.
What could be improved?
- Filtering would be good.
- Locations with multiple episodes are not apparent.
- The title doesn't really explain what the viz is about.
What I did
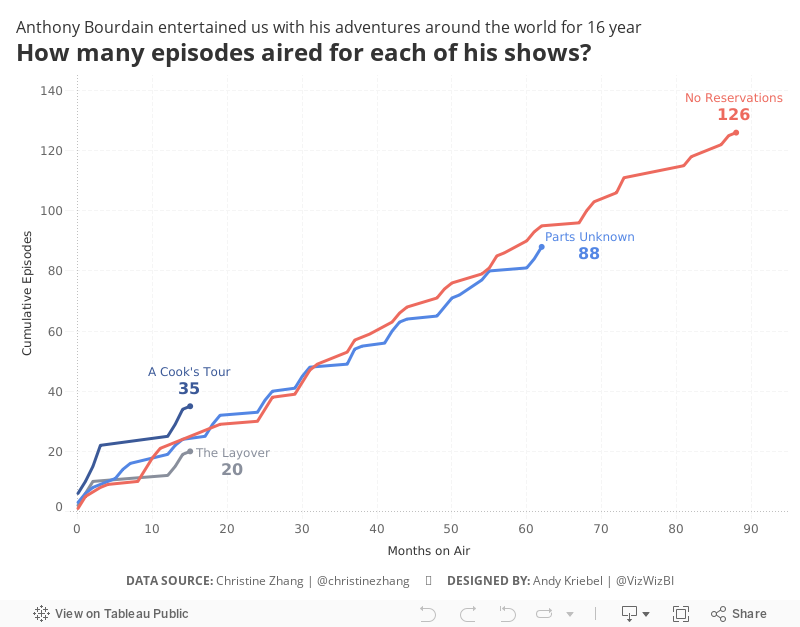
- Focused on the frequencies of the shows as I'm not totally familiar with all of them
- Made the map information supplementary through the tooltip
- Use a title that explains what the viz is about
Special thank you to Christine Zhang for this week's data set.
July 20, 2015
Makeover Monday: American Teens Are Abandoning TV in Droves
Americans
,
bar chart
,
Business Insider
,
change
,
highlight
,
line chart
,
Makeover Monday
,
television
,
time spent
,
TV
Business Insider UK posted this simple chart a couple weeks ago about the change in the amount of time Americans aged 12-17 are spending watching TV.

What struck me most about this choice of chart is how difficult it is to see the trend. Because of its design, your eyes have to move from quarter to quarter, match up the bar colors, then once you hit Q4, go all the way back to the left. This is way too much work for the reader. On top of that, you have to calculate the rate of change in your head.
I created this simple version, very much in the spirit of what I leared at one of Cole Nussbaumer’s workshops.

What I’ve done is:
This view makes the story much, much simpler to see and adds the necessary context. You can download the data here and the Tableau workbook here.
I created this simple version, very much in the spirit of what I leared at one of Cole Nussbaumer’s workshops.
What I’ve done is:
- Visualize the entire time period as one continuous line
- Highlight the beginning and end of the time period
- Include the rate of change from the start to the end
This view makes the story much, much simpler to see and adds the necessary context. You can download the data here and the Tableau workbook here.
January 14, 2015

April 20, 2012
Nielsen’s Advertising & Audiences Report – A poor infographic redesigned for simplicity
advertising
,
audiences
,
bar chart
,
chart junk
,
genre
,
infographic
,
Nielsen
,
primetime
,
tableau
,
TV
12 comments
Nielsen published this infographic as part of their Advertising & Audiences Report:

Ok, Nielsen, I see that you’re trying to be cute.
- You made an old fashioned TV the background image (which many young people won’t even recognize)
- You used blocks to represents a parts-to-whole relationship. Maybe you used blocks so that children would be reminded of Legos.
- You chose background colors to remind us of how a TV would look when it had no signal way back when
But it’s all a bit too much for me. I find myself trying to count each of the blocks. My eyes are darting back and forth to the color legend. The value labels sometimes don’t even line up with the associated color.
Are you getting consulting from David McCandless? You must be!
Simplify things. Communicate more effectively. Save yourself time.

This took all of 10 minutes in Tableau. How long did it take you to create your infographic? I bet significantly longer.
Subscribe to:
Posts
(
Atom
)






