Showing posts with label fistula. Show all posts
March 5, 2019
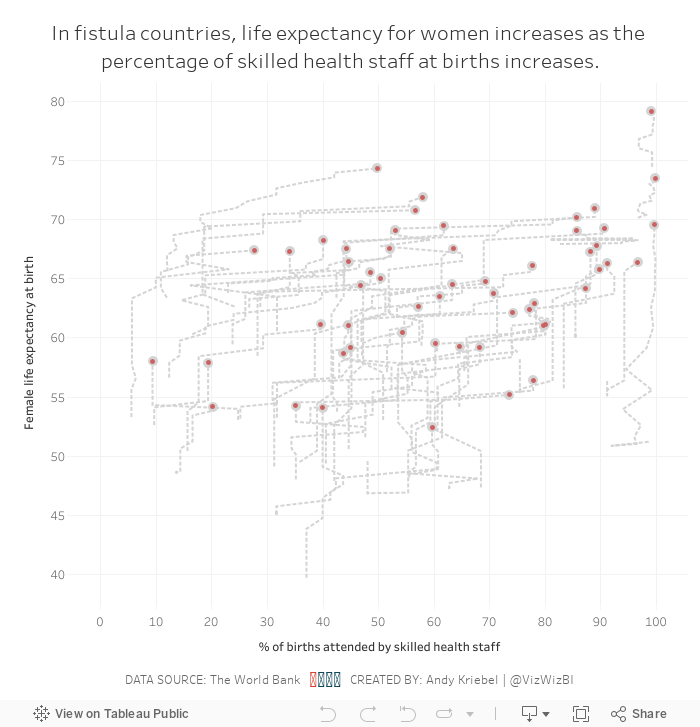
Makeover Monday Power BI Edition: Births Attended by Skilled Health Staff vs. Female Life Expectancy as a Motion Chart

What's one to do? Try a tool that does support animation. In this case, Power BI. Scatter plots in Power BI support animation natively and it took less than five minutes to create this.
- Upload the data.
- Choose the measure for the x-axis and place it on the X Axis shelf.
- Choose the measure for the y-axis and place it on the Y Axis shelf.
- Add a dimension to the Details shelf to draw more dots.
- Place the dimension to animation across, i.e., years, on the Play Axis shelf.
- Add a title.
- Add a text box as a footer.
BOOM! Done! Easy peasy. Check it out below.
March 4, 2019
Makeover Monday: Are skilled health staff an indicator of female life expectancy in fistula countries?


What work well?
- Using a continuous color palette
- There are no exceptionally large countries compared to the others, so a filled map is a good choice.
- Normalizing the data to make comparisons across countries more relevant.
- Using grey for countries with no data.
- Good title and subtitle
What could be improved?
- If there is data across years, it would provide additional context to the data. In other words, is the situation improving?
- Make the title bigger; it's too small compared to the large map.
My Goals
- Compared the metrics between fistula and non-fistula countries
- Look at change over time
- Figure out how to deal with all of the nulls
- Be done
Subscribe to:
Posts
(
Atom
)






