Showing posts with label presidentbush. Show all posts
September 3, 2010
Tableau Tip: Creating a Waterfall Gantt Chart
eagereyes
,
gantt
,
presidentbush
,
provotis
,
tableau
,
tableau public
,
waterfall
6 comments
I keep up with the website eagereyes regularly and recently they ran a three-part series titled "A Protovis Primer" in which they introduced the tool Protovis. Protovis is an open-source tool that allows you to create data visualizations.
Part 3 of the series was dedicated to instructions for creating a waterfall chart. If you take a quick look at the tutorial (well, there is no way to read it quickly), you will see that the method they have for creating a simple waterfall chart is in fact quite complicated and requires a lot of coding.
There's a much simpler way to do it...use Tableau. Here's the step by step way todo it create a Gantt chart using the same Presidential data eargeyes used (I added data from different polls that ranks all of the Presidents). Get the data here.
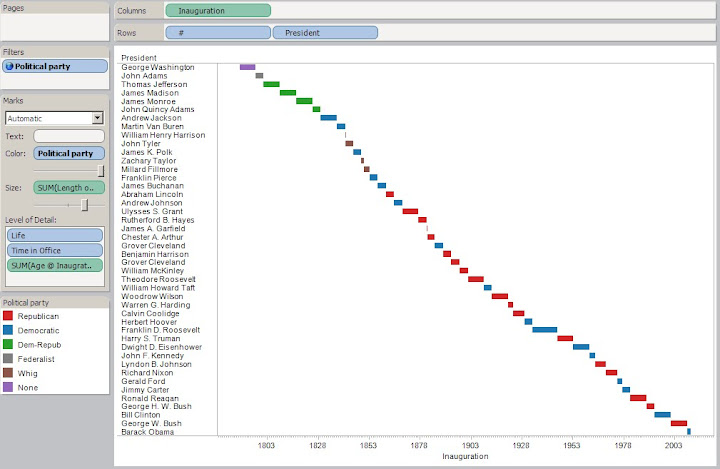
Step 1 - Add Inauguration to the column shelf and # and President to the row shelf. You need to have the # field so that the Presidents are listed in order from Washington to Obama.

Step 2 - Right-click on the YEAR(Inauguration) field and choose "All Values". This is required otherwise the time scale will not allow you to connect the start and end dates.

Step 3 - Right-click on the # field and uncheck "Show Header". This will hide the # column, yet still use it for sorting purposes.

Step 4 - Create a calculated field named Length of Presidency and drop it on the Size shelf (this gives the bar its length)

Step 5 - Create three calculated fields (Life, Time in Office, Age @ Inauguration) and place them on the Level of Detail shelf.


The end result should be awaterfall Gantt chart like this (I removed the grid lines):
That's it! Very simple, especially after you do it a few times.
Going a step farther, I created a "timeline" that highlights the times each political party was in office. Here are all of the settings:
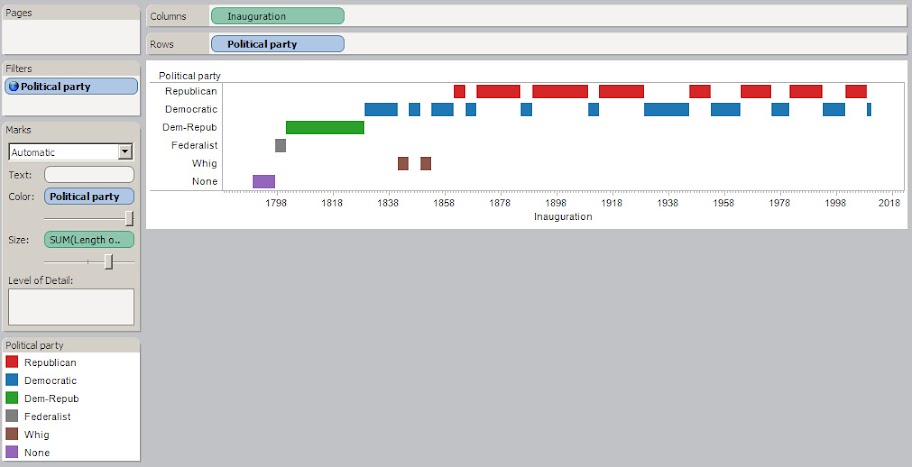
I put it all together in a dashboard. I made the Political Party field a global filter and highlighting is enabled when you click on the color of Political Party on the right. Finally, I published the workbook to Tableau Public.

Give it a shot. Download the Tableau Packaged Workbook.
Part 3 of the series was dedicated to instructions for creating a waterfall chart. If you take a quick look at the tutorial (well, there is no way to read it quickly), you will see that the method they have for creating a simple waterfall chart is in fact quite complicated and requires a lot of coding.
There's a much simpler way to do it...use Tableau. Here's the step by step way to
Step 1 - Add Inauguration to the column shelf and # and President to the row shelf. You need to have the # field so that the Presidents are listed in order from Washington to Obama.
Step 2 - Right-click on the YEAR(Inauguration) field and choose "All Values". This is required otherwise the time scale will not allow you to connect the start and end dates.
Step 3 - Right-click on the # field and uncheck "Show Header". This will hide the # column, yet still use it for sorting purposes.
Step 4 - Create a calculated field named Length of Presidency and drop it on the Size shelf (this gives the bar its length)
Step 5 - Create three calculated fields (Life, Time in Office, Age @ Inauguration) and place them on the Level of Detail shelf.
The end result should be a
That's it! Very simple, especially after you do it a few times.
Going a step farther, I created a "timeline" that highlights the times each political party was in office. Here are all of the settings:
I put it all together in a dashboard. I made the Political Party field a global filter and highlighting is enabled when you click on the color of Political Party on the right. Finally, I published the workbook to Tableau Public.
Give it a shot. Download the Tableau Packaged Workbook.
February 17, 2010
Road to Recovery
barackobama
,
barchart
,
economy
,
jobs
,
OFA
,
presidentbush
,
presidentobama
No comments
It's very difficult to get a true account of the job situation in America, but one measurement that is often used is job losses. Organizing for America published the chart below today to provide their view of the state of jobs in the US. While statistics can be skewed to suit the author's message, I simply saw this as an example of a well constructed chart. For me, the best part of this chart was that it communicated its story effectively without much need for interpretation.


October 8, 2009
Auto Sales & Unemployment
cars
,
cashforclunkers
,
danmurray
,
facebook
,
FRED
,
government
,
iraq
,
politics
,
presidentbush
,
tomprice
,
unemployment
,
wallstreetjournal
,
war
,
WSJ
3 comments
Before you judge my political views, let me first say that I think ALL politicians are frauds and that few of them represent anyone except the special interest groups that support their campaigns.
I received the following message from Congressman Tom Price on Monday (10/5/09): "Last week we received more bad news in the job market. 263,000 jobs were lost during the month of September and the unemployment rate is now at 9.8%. The verdict is in and the economic policies of President Obama and Democrats in Congress have become a massive failure."
I understand Congressman Price's position, but it bothers me that he has taken the lead of talk show hosts to use scare tactics to spread his message. I would, for once, like to hear his opinion. His entire rant can be found here.
In addition, my friend Dan Murray posted a link to a Wall Street Journal article on his Facebook page that essentially said the "Cash For Clunkers" program failed.
I wanted to see if I could draw any sort of correlation, or at least possibly provide the specific details.
Here is my visualization:

First, to Congressman Price's accusations. The rise in unemployment started around January 2007. Obviously President Obama was not yet in office. So what happened that could have sparked the sudden rise? This is precisely when President Bush announced the surge in troops for the Iraq War during his State of the Union address. I can't say that was the exact cause, but I do find the timing neatly coincidental.
Now, onto the WSJ's claims that Cash for Clunkers failed to help the economy. Yes, there was a huge decline in new car sales in September, but this is not unprecedented if you look at historical sales.
Back in October 2001, the "0% interest" programs were introduced by the Big 3. This program was a HUGE boost to sales (35% over prior month), but it resulted in a decline of 18% in November and 25% over the following two months.
The Big 3 introduced the "Employee Pricing" programs in July 2005. This program was another HUGE "success" (sales increased 15% over prior month and 22% over May), but it resulted in a decline of 18% in August, 20% through September, and 28% through October.
The Cash For Clunkers program (August 2009), resulted in a 4.4M units increase in sales over June or 45%. That increase has never been approached in the last 10 years. The results, however, was a decreased in sales in September of 4.9M units or 35%. If this program follows the behavior of the previous two, we should see a decrease of an additional ~7% over the next 1-2 months at which time sales should stabilize.
Now, I want to take a leap to connect the two (auto sales and unemployment). A significant number of people were employed by the Big 3, so when auto sales take a nose dive, you would have to expect that they would begin laying off workers, which would ultimately have a direct impact on the national unemployment rate.
Back to President Bush. I cannot directly correlate his Address to these figures, but the timing sure is suspect.
* All data courtesy of FRED.
I received the following message from Congressman Tom Price on Monday (10/5/09): "Last week we received more bad news in the job market. 263,000 jobs were lost during the month of September and the unemployment rate is now at 9.8%. The verdict is in and the economic policies of President Obama and Democrats in Congress have become a massive failure."
I understand Congressman Price's position, but it bothers me that he has taken the lead of talk show hosts to use scare tactics to spread his message. I would, for once, like to hear his opinion. His entire rant can be found here.
In addition, my friend Dan Murray posted a link to a Wall Street Journal article on his Facebook page that essentially said the "Cash For Clunkers" program failed.
I wanted to see if I could draw any sort of correlation, or at least possibly provide the specific details.
Here is my visualization:
First, to Congressman Price's accusations. The rise in unemployment started around January 2007. Obviously President Obama was not yet in office. So what happened that could have sparked the sudden rise? This is precisely when President Bush announced the surge in troops for the Iraq War during his State of the Union address. I can't say that was the exact cause, but I do find the timing neatly coincidental.
Now, onto the WSJ's claims that Cash for Clunkers failed to help the economy. Yes, there was a huge decline in new car sales in September, but this is not unprecedented if you look at historical sales.
Back in October 2001, the "0% interest" programs were introduced by the Big 3. This program was a HUGE boost to sales (35% over prior month), but it resulted in a decline of 18% in November and 25% over the following two months.
The Big 3 introduced the "Employee Pricing" programs in July 2005. This program was another HUGE "success" (sales increased 15% over prior month and 22% over May), but it resulted in a decline of 18% in August, 20% through September, and 28% through October.
The Cash For Clunkers program (August 2009), resulted in a 4.4M units increase in sales over June or 45%. That increase has never been approached in the last 10 years. The results, however, was a decreased in sales in September of 4.9M units or 35%. If this program follows the behavior of the previous two, we should see a decrease of an additional ~7% over the next 1-2 months at which time sales should stabilize.
My take: the auto industry waited too long to offer another teaser program.
Now, I want to take a leap to connect the two (auto sales and unemployment). A significant number of people were employed by the Big 3, so when auto sales take a nose dive, you would have to expect that they would begin laying off workers, which would ultimately have a direct impact on the national unemployment rate.
Back to President Bush. I cannot directly correlate his Address to these figures, but the timing sure is suspect.
* All data courtesy of FRED.
Subscribe to:
Posts
(
Atom
)


