Showing posts with label WSJ. Show all posts
June 29, 2015
Makeover Monday: A Day in the Life
Americans
,
bullet graph
,
chart junk
,
Emma Whyte
,
infographic
,
Information Lab
,
Makeover Monday
,
wall street journal
,
WSJ
No comments

I found an infographic on Twitter this week from the Wall Street Journal that described the average American's day.
What Americans did with their time last year: more work, more sleep, more TV, less school http://t.co/MhLZkOBBdU pic.twitter.com/TIJB6FR4y1
— Nick Timiraos (@NickTimiraos) June 25, 2015
There are several problems with this infographic:
- It's really hard to see easily what American's spend most and least of their time doing
- It's difficult to compare the years - the colour encoding helps, but you have to work out the actual change in your head
- Your eyes have to look around a lot to get the whole picture
- There's a lot of reading involved
- The squares equal one minute - but it's hard to compare values using area I had a go at making an alternative.
I have to admit I couldn't find the same data set that the Wall Street Journal used. I downloaded this one from the Bureau of Labor Stats (hence my numbers don't exactly match).
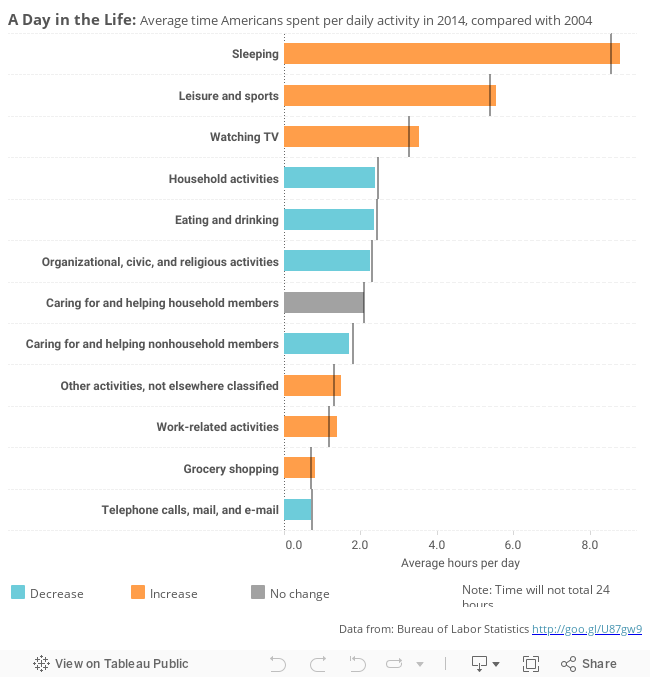
In this version I have:
- Changed the infographic to a bullet chart - the bars show the 2014 values and the reference line 2004 values.
- Sorted the bars by the 2014 value
- Coloured the bars by the change, to let you easily spot increases / decreases
- Added tool-tips to show the actual change (rather than doing the Math in your head)
You can download my viz from Tableau Public here.
Would you do anything differently?
February 4, 2013
Improving the WSJ Historical U.S. Unemployment Rates heat map
comparison
,
gantt
,
heat map
,
kraken
,
table
,
tableau
,
time series
,
unemployment
,
United States
,
WSJ
4 comments
In chapter 1 of Alberto Cairo’s book, The Functional Art, he presents this chart by the Wall Street Journal as an example of non-figurative graphics.

I was struck at first by the use of a red/green color palette (so many people use this to represent positive and negative situations). Then I realized that it need a bit more to really make it useful. I wanted to be able to:
- Understand the magnitudes of the rates
- Compare years
- Fix the color scheme
- Make the chart wider
Here’s what I created using the Tableau 8 (all of this can be done in 7). Does it answer my questions?

July 2, 2010
Implicit Comparison
The July 1st ChartPorn daily blog post linked to an interesting interactive graphic for economic indicators from the Wall Street Journal, which the author calls "Danger Signs."
The first graph that appears is called Summer Chills. There are two graphs, one for consumer confidence and one for yield on the 10-yr treasury. When I first looked at this, my impression was that the two charts were related. If you carefully read the caption, you can see that they aren't.

I see some issues between the graphs:
The first graph that appears is called Summer Chills. There are two graphs, one for consumer confidence and one for yield on the 10-yr treasury. When I first looked at this, my impression was that the two charts were related. If you carefully read the caption, you can see that they aren't.

I see some issues between the graphs:
- The time frames are different. The CCI graph goes from 2007 through June 2010 and it's by month. However, the 10-yr treasury yield is for the current year and it's by day.
- The scale on the 10-yr treasury yield graph is not zero-based, which leads to variances between points that are greater than the relative variance.
- The reference bands are a bit distracting.
- The level of precision on the mark on the 10-yr treasury yield graph is not necessary. Go with two decimals since that's how it's typically reported.
Some things I like:
- Highlighting the current period and adding a data label
- Chart headers are clear
- Fonts used
- Line colors stand out, grabbing your attention
Here's how I would represent the data:

The improvements I have made (for each problem noted above):
The improvements I have made (for each problem noted above):
- The time frames are now consistent; they start at January 2007 and go through June 2010. They also are by month only.
- The scale on the 10-yr treasury yield graph is now zero-based.
- The reference bands have been muted and I've started them at the 2nd range, not at the bottom.
- The line for each measure is a different coloring, triggering you to notice they are distinct.
- Finally, I added a dual-axis line chart that shows the relationship between the measures.
While the point the author is trying to represent is valid, properly created graphs are essential to tell the true story.
October 8, 2009
Auto Sales & Unemployment
cars
,
cashforclunkers
,
danmurray
,
facebook
,
FRED
,
government
,
iraq
,
politics
,
presidentbush
,
tomprice
,
unemployment
,
wallstreetjournal
,
war
,
WSJ
3 comments
Before you judge my political views, let me first say that I think ALL politicians are frauds and that few of them represent anyone except the special interest groups that support their campaigns.
I received the following message from Congressman Tom Price on Monday (10/5/09): "Last week we received more bad news in the job market. 263,000 jobs were lost during the month of September and the unemployment rate is now at 9.8%. The verdict is in and the economic policies of President Obama and Democrats in Congress have become a massive failure."
I understand Congressman Price's position, but it bothers me that he has taken the lead of talk show hosts to use scare tactics to spread his message. I would, for once, like to hear his opinion. His entire rant can be found here.
In addition, my friend Dan Murray posted a link to a Wall Street Journal article on his Facebook page that essentially said the "Cash For Clunkers" program failed.
I wanted to see if I could draw any sort of correlation, or at least possibly provide the specific details.
Here is my visualization:

First, to Congressman Price's accusations. The rise in unemployment started around January 2007. Obviously President Obama was not yet in office. So what happened that could have sparked the sudden rise? This is precisely when President Bush announced the surge in troops for the Iraq War during his State of the Union address. I can't say that was the exact cause, but I do find the timing neatly coincidental.
Now, onto the WSJ's claims that Cash for Clunkers failed to help the economy. Yes, there was a huge decline in new car sales in September, but this is not unprecedented if you look at historical sales.
Back in October 2001, the "0% interest" programs were introduced by the Big 3. This program was a HUGE boost to sales (35% over prior month), but it resulted in a decline of 18% in November and 25% over the following two months.
The Big 3 introduced the "Employee Pricing" programs in July 2005. This program was another HUGE "success" (sales increased 15% over prior month and 22% over May), but it resulted in a decline of 18% in August, 20% through September, and 28% through October.
The Cash For Clunkers program (August 2009), resulted in a 4.4M units increase in sales over June or 45%. That increase has never been approached in the last 10 years. The results, however, was a decreased in sales in September of 4.9M units or 35%. If this program follows the behavior of the previous two, we should see a decrease of an additional ~7% over the next 1-2 months at which time sales should stabilize.
Now, I want to take a leap to connect the two (auto sales and unemployment). A significant number of people were employed by the Big 3, so when auto sales take a nose dive, you would have to expect that they would begin laying off workers, which would ultimately have a direct impact on the national unemployment rate.
Back to President Bush. I cannot directly correlate his Address to these figures, but the timing sure is suspect.
* All data courtesy of FRED.
I received the following message from Congressman Tom Price on Monday (10/5/09): "Last week we received more bad news in the job market. 263,000 jobs were lost during the month of September and the unemployment rate is now at 9.8%. The verdict is in and the economic policies of President Obama and Democrats in Congress have become a massive failure."
I understand Congressman Price's position, but it bothers me that he has taken the lead of talk show hosts to use scare tactics to spread his message. I would, for once, like to hear his opinion. His entire rant can be found here.
In addition, my friend Dan Murray posted a link to a Wall Street Journal article on his Facebook page that essentially said the "Cash For Clunkers" program failed.
I wanted to see if I could draw any sort of correlation, or at least possibly provide the specific details.
Here is my visualization:
First, to Congressman Price's accusations. The rise in unemployment started around January 2007. Obviously President Obama was not yet in office. So what happened that could have sparked the sudden rise? This is precisely when President Bush announced the surge in troops for the Iraq War during his State of the Union address. I can't say that was the exact cause, but I do find the timing neatly coincidental.
Now, onto the WSJ's claims that Cash for Clunkers failed to help the economy. Yes, there was a huge decline in new car sales in September, but this is not unprecedented if you look at historical sales.
Back in October 2001, the "0% interest" programs were introduced by the Big 3. This program was a HUGE boost to sales (35% over prior month), but it resulted in a decline of 18% in November and 25% over the following two months.
The Big 3 introduced the "Employee Pricing" programs in July 2005. This program was another HUGE "success" (sales increased 15% over prior month and 22% over May), but it resulted in a decline of 18% in August, 20% through September, and 28% through October.
The Cash For Clunkers program (August 2009), resulted in a 4.4M units increase in sales over June or 45%. That increase has never been approached in the last 10 years. The results, however, was a decreased in sales in September of 4.9M units or 35%. If this program follows the behavior of the previous two, we should see a decrease of an additional ~7% over the next 1-2 months at which time sales should stabilize.
My take: the auto industry waited too long to offer another teaser program.
Now, I want to take a leap to connect the two (auto sales and unemployment). A significant number of people were employed by the Big 3, so when auto sales take a nose dive, you would have to expect that they would begin laying off workers, which would ultimately have a direct impact on the national unemployment rate.
Back to President Bush. I cannot directly correlate his Address to these figures, but the timing sure is suspect.
* All data courtesy of FRED.
Subscribe to:
Posts
(
Atom
)






