Showing posts with label progress. Show all posts
June 7, 2019
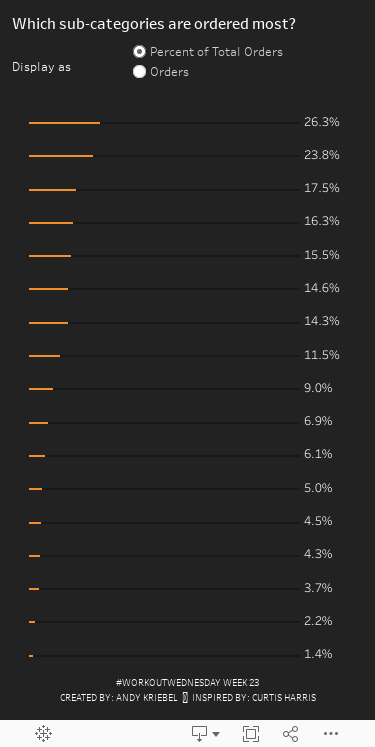
#WorkoutWednesday Week 23: Which sub-categories are ordered most?
bar chart
,
Curtis Harris
,
mobile
,
parameter
,
progress
,
subtotal
,
Workout Wednesday
No comments

REQUIREMENTS
- Create a bar chart which displays the sub-category label on top of its bar
- Label all bars to the right of the maximum value in view
- Create a parameter that changes the display from a percent of total view to a raw order count view
- Create a progress shadow for every bar
- Show progress to 100% or progress to the maximum value depending on the parameter selection
- Only use one sheet
- Match formatting and colors
- Match tooltips
The part that tripped me up the most was labeling the sub-category above the bar. I had done this before, but couldn't remember how, and I didn't to look back; I wanted to figure it out again. One other thing I wanted to do was make sure that the text didn't overlap the bar as it shows in the viz to rebuild (sorry Curtis, I know it's not 100% correct now).
To do this:
- Add Sub-Category on the rows twice.
- Hide the headers
- Turn on subtotals
- Move the column subtotals to the top
- Add a dummy measure as a secondary axis with the value 0
- Make sure the mark type is a circle on this shelf
- Add Sub-Category to the text shelf on the shelf with the circle and add an extra line below it in the text box with a space. This forces an extra line.
Tada! Fun one Curtis!
September 22, 2015
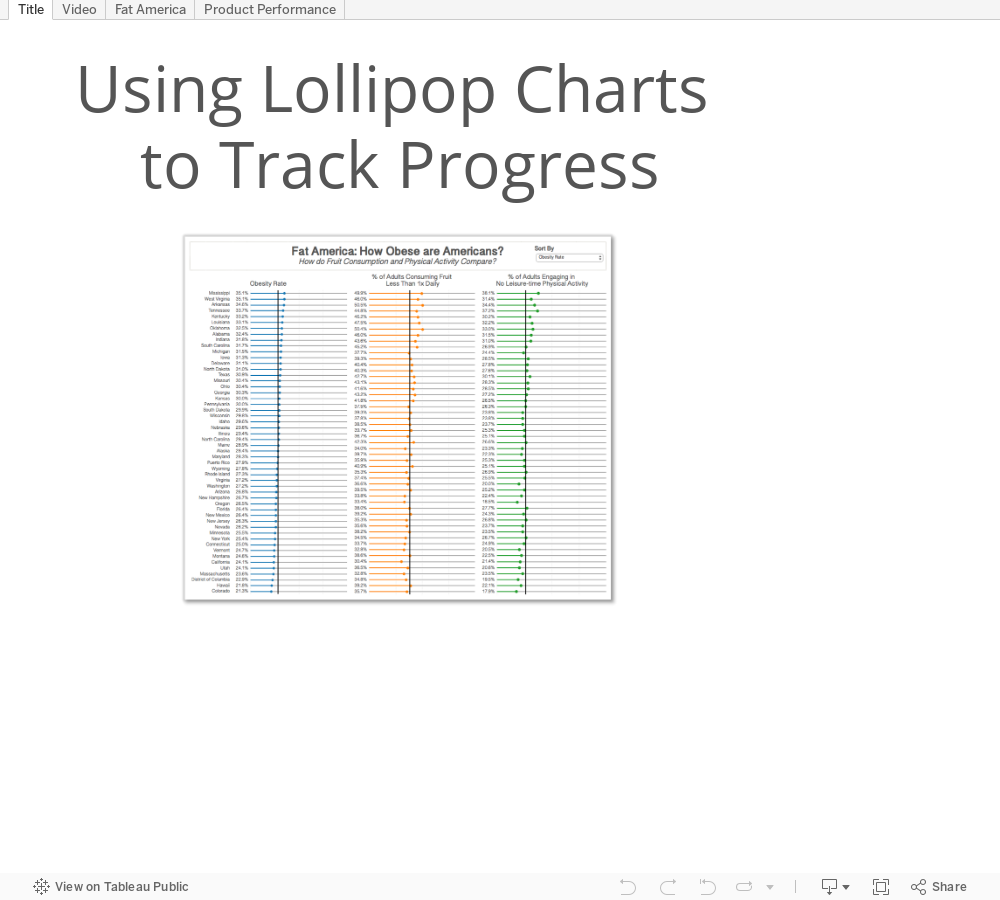
Tableau Tip Tuesday: Using Lollipop Charts to Track Progress
Alberto Cairo
,
import.io
,
lollipop
,
progress
,
tableau
,
tips
,
Tuesday
,
wdc
,
web data connector
5 comments

I was first exposed to using lollipop charts to track progress by Alberto Cairo back in January 2013. In the viz, I used lollipop charts to show the percentage of educated and obese people by State in the U.S. I realized I never wrote about how to create them, so in this tip, I’m going to show you several things:
It’s a bit of a long video since there’s so much to cover. If there’s anything else you’d like me to create videos for, please let me know in the comments below.
 NOTE: After creating the video, I did quite a bit of formatting on the visualisations to get the sorting to keep the sheets in sync and to create the second dashboard. I’d highly recommend you download the workbook to see how I did it. Particularly, see the LOD calc I had to create to get the sorting to work on the sparklines.
- How to use import.io to get the data
- How to use the Tableau Web Data Connector to bring data into Tableau from import.io
- How to build the lollipop progress charts
- Options for customising the view
- A practical example that will likely apply to your work
It’s a bit of a long video since there’s so much to cover. If there’s anything else you’d like me to create videos for, please let me know in the comments below.
Subscribe to:
Posts
(
Atom
)


