September 22, 2015
Tableau Tip Tuesday: Using Lollipop Charts to Track Progress
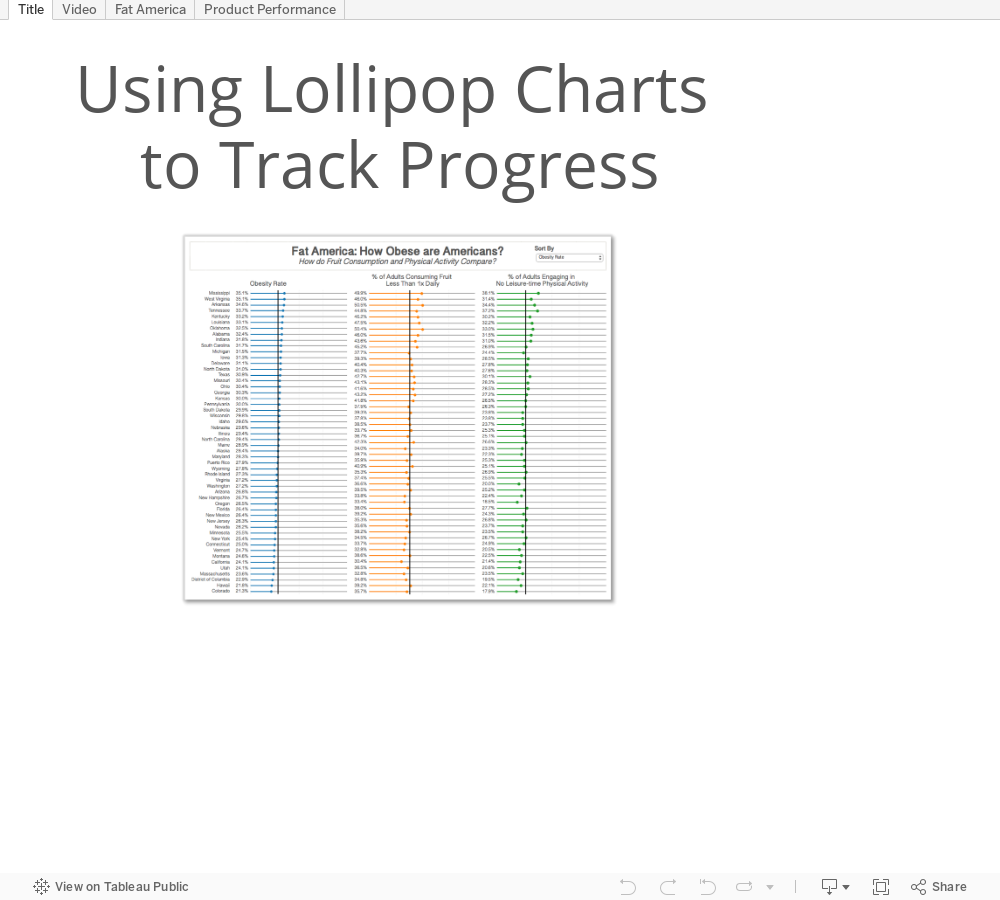
Alberto Cairo
,
import.io
,
lollipop
,
progress
,
tableau
,
tips
,
Tuesday
,
wdc
,
web data connector
5 comments

I was first exposed to using lollipop charts to track progress by Alberto Cairo back in January 2013. In the viz, I used lollipop charts to show the percentage of educated and obese people by State in the U.S. I realized I never wrote about how to create them, so in this tip, I’m going to show you several things:
It’s a bit of a long video since there’s so much to cover. If there’s anything else you’d like me to create videos for, please let me know in the comments below.
 NOTE: After creating the video, I did quite a bit of formatting on the visualisations to get the sorting to keep the sheets in sync and to create the second dashboard. I’d highly recommend you download the workbook to see how I did it. Particularly, see the LOD calc I had to create to get the sorting to work on the sparklines.
- How to use import.io to get the data
- How to use the Tableau Web Data Connector to bring data into Tableau from import.io
- How to build the lollipop progress charts
- Options for customising the view
- A practical example that will likely apply to your work
It’s a bit of a long video since there’s so much to cover. If there’s anything else you’d like me to create videos for, please let me know in the comments below.
Subscribe to:
Post Comments
(
Atom
)


Hi, Very Nice..
ReplyDeleteI want to get to know how to sync sheets without that scrollbar
It will be helpful if Download workbook access is provided.
You cannot sync scroll bars. To download, scroll right and down if the whole viz doesn’t display in your window.
DeleteThanks for the reply Andy,
DeleteI am able to see download button, but it shows as "Permission required to download the workbook"
Only Download of Image and Pdf options available.
Gotcha! It's fixed now. Thanks for letting me know.
DeleteThanks Andy !!
Delete