September 2, 2015
Dear Data Two | Week 14: Productivity
calendar
,
Dear Data Two
,
dot plot
,
dual axis
,
events
,
fitbit
,
gantt
,
Moves
,
productivity
,
schedule
,
sunrise
2 comments

Nearly caught up on the weeks I had to skip. Week 14 was pretty straight forward, but I wanted my gantt chart to look a bit fancier so I put dots on the ends. For this type of lollipop Gantt chart, you need to use both axes. I'll show how to do this for Tableau Tip Tuesday next week.
To collect the data for this week, I combined data from Moves (for places and times), Fitbit (for sleeping) and Sunrise (for my calendar). I entered everything manually into Excel and connected it to Tableau.
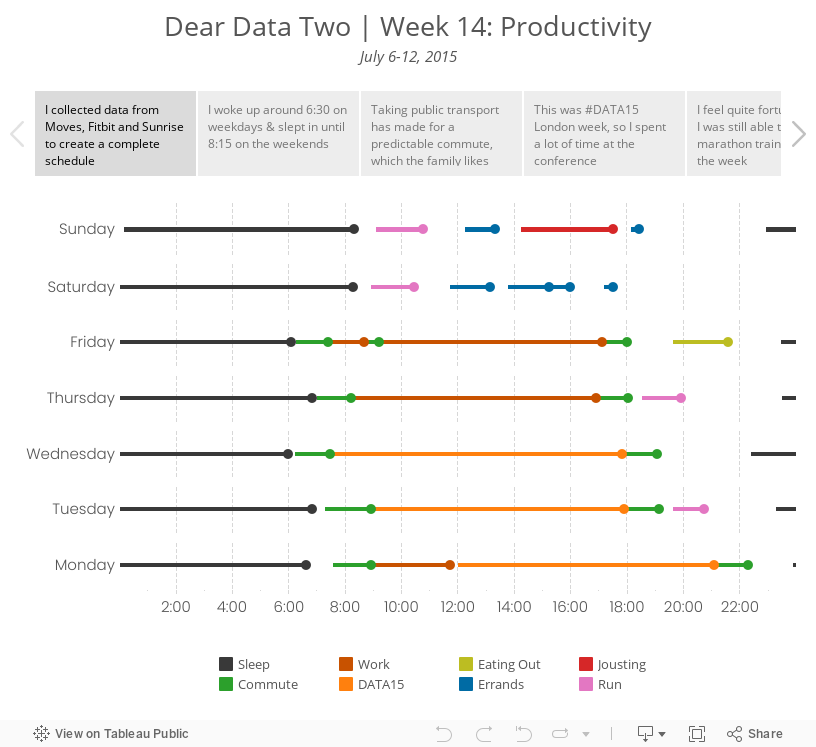
To collect the data for this week, I combined data from Moves (for places and times), Fitbit (for sleeping) and Sunrise (for my calendar). I entered everything manually into Excel and connected it to Tableau.
Subscribe to:
Post Comments
(
Atom
)


Hi, After downloading the Tableau Workbook it doesnt open in Tableau Desktop due to an error. Can you help?
ReplyDeleteThat's likely because I created this in 9.1. When you download the workbook, you can unzip it. You will then see the .twb file. Open that with a text editor and everywhere you see 9.1, replace it with 9.0. Save and open with Tableau 9 and you should be all set.
Delete