Showing posts with label rounded. Show all posts
May 31, 2021
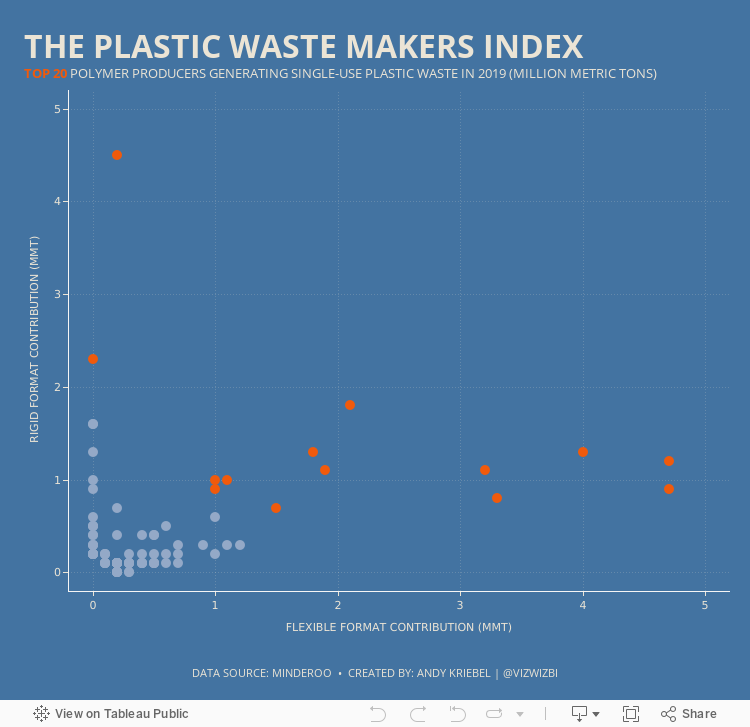
#MakeoverMonday 2021 Week 22: The Plastic Waste Makers Index
bar chart
,
bins
,
box plot
,
calculated field
,
distribution
,
histogram
,
jitter
,
parameter
,
parameter action
,
random
,
rounded
,
scatter plot
,
scatterplot
,
set
,
sort
,
stacked
No comments

August 29, 2018
Tableau Tip: How to Create Rounded Bar Charts
I've used rounded bar charts a few Makeover Mondays. I received an email from a reader yesterday about how to create them, so I decided to make a video in case anyone else has the same question going forward.
The end goal is a chart that looks like this:

You can download the workbook by clicking on the download link on the toolbar below the video.
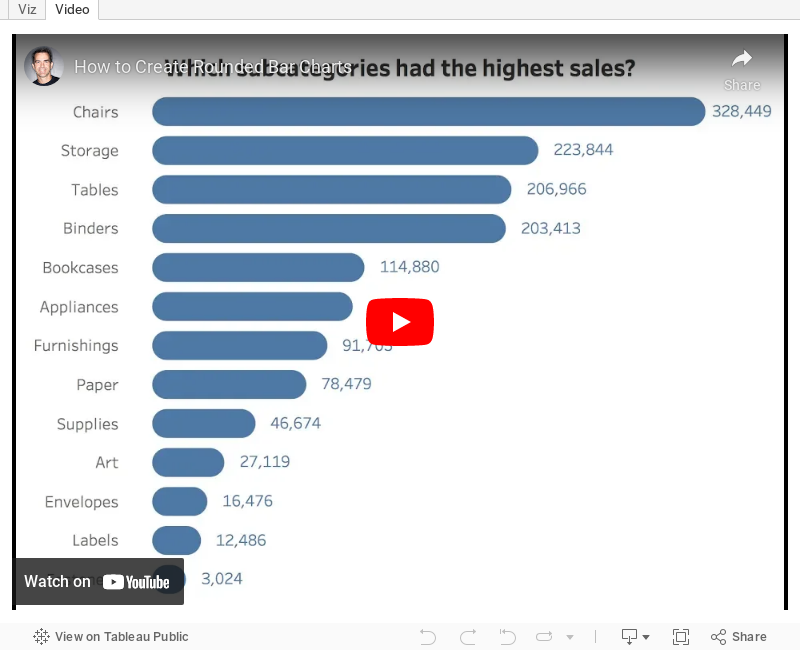
The end goal is a chart that looks like this:
You can download the workbook by clicking on the download link on the toolbar below the video.
Subscribe to:
Posts
(
Atom
)






