Showing posts with label sample. Show all posts
June 30, 2021
Sample KPI Dashboard
color
,
comparison
,
containers
,
context
,
dashboard
,
design
,
KPI
,
kpi dashboard
,
layout
,
level of detail
,
LOD
,
sample
,
tableau
,
tableau dashboard
,
template
,
trend
No comments
This week at The Data School, I was teaching DS24 about dashboard best practices and how to effectively use containers. We picked a visualization from the wild (this one by Ryan Sleeper) as an example for us to rebuild and to learn about effective use of containers.
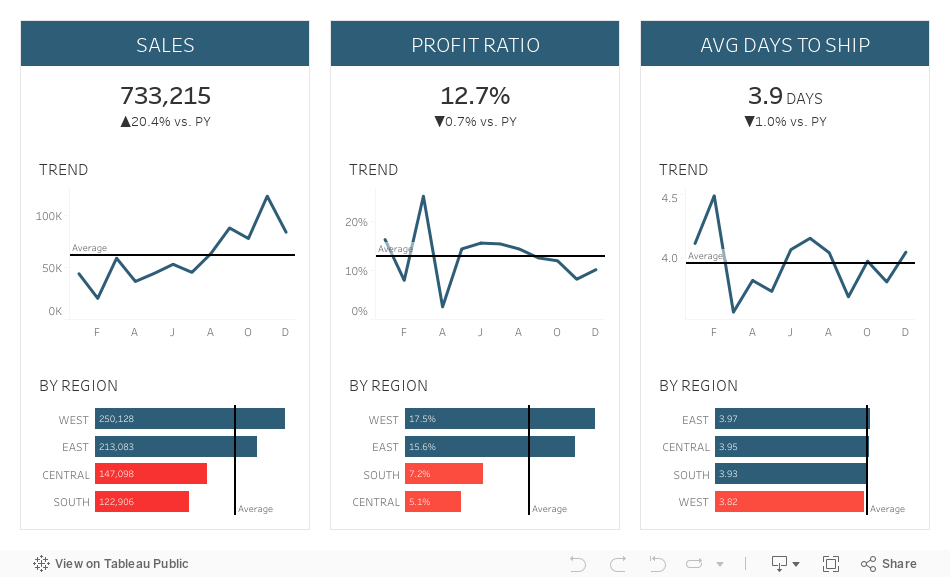

If you'd like to learn more, here are two videos I produced about mastering containers:
- Mastering Containers (Part 1)
- Mastering Containers (Part 2)
To see how we build the example below, feel free to download it and pick it apart. However, if you really want to learn how to build something like this, try to rebuild it based on the image alone. The videos above will definitely help.
Thank you Ryan for the inspiration!
December 15, 2017
Visualizing IT Help Desk Performance
dashboard
,
example
,
help desk
,
IT
,
KPI
,
performance
,
sample
14 comments
I'm looking for some good examples of Customer Support dashboards (incidents, hours worked, forecasting, etc.).
I did a quick Google search and a search on Tableau Public and didn't find anything that was particularly good or useful (even from the support desk software vendors themselves). So I decided the best way to help was to create an example.
I didn't have any data, but I found this dataset on IBM's Watson Analytics website as a sample. The data set contains 100,000 records yet didn't include a date for when tickets were opened. It included a field for how many days a ticket was open though. What to do?
- Create a new column to generate a random date (to the second) between Jan 1 2014 and Dec 31 2016,
- Added a column for the Closed Date based on the difference between the Open Date and the days the ticket was open.
- Randomly removed the Closed Date for some of the records so that I would have some tickets that were not closed (because that's reality).
BOOM! Sample data set done! You can download it here.
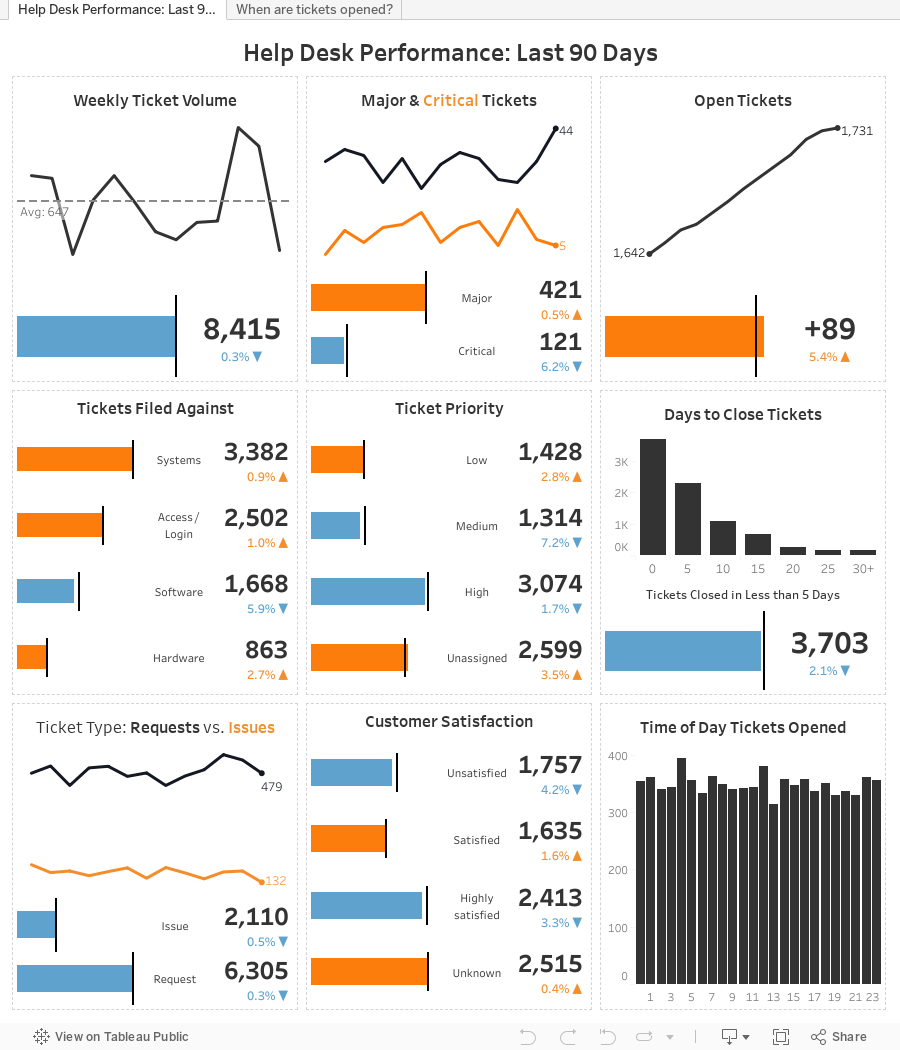
From there, I went back to my Google image search to get an idea for the metrics that were important. Many of the designs has a "card" style layout, so I create a design very similar to the P&L statement I created before.
I posted iterations throughout the day and into the evening and got feedback from Eva and Mark Kernke (of Groupon) as he had a similar need. Based on their feedback, here's where I ended up. This is merely a framework, but shows what a IT help desk performance dashboard COULD look like.
I hope you like it! Oh, bonus, there's a mobile version too. Check it out on your phone.
Subscribe to:
Posts
(
Atom
)






