October 28, 2014
My first experience with import.io and Tableau
Alex Gimson
,
arsenal
,
English Premier League
,
EPL
,
import.io
,
interactive
,
Jewel Loree
,
soccer
,
tableau
3 comments
Remember when you first found Tableau and realized you would never use Excel to create charts again? Well, I had a similar eureka moment last Thursday when I sat in on a great webinar by import.io hosted by Alex Gimson - Build Grow Scale: Getting started with import.io. The difference here is that I will no longer need to copy/paste from webpages; import.io will do all of the work for me!!
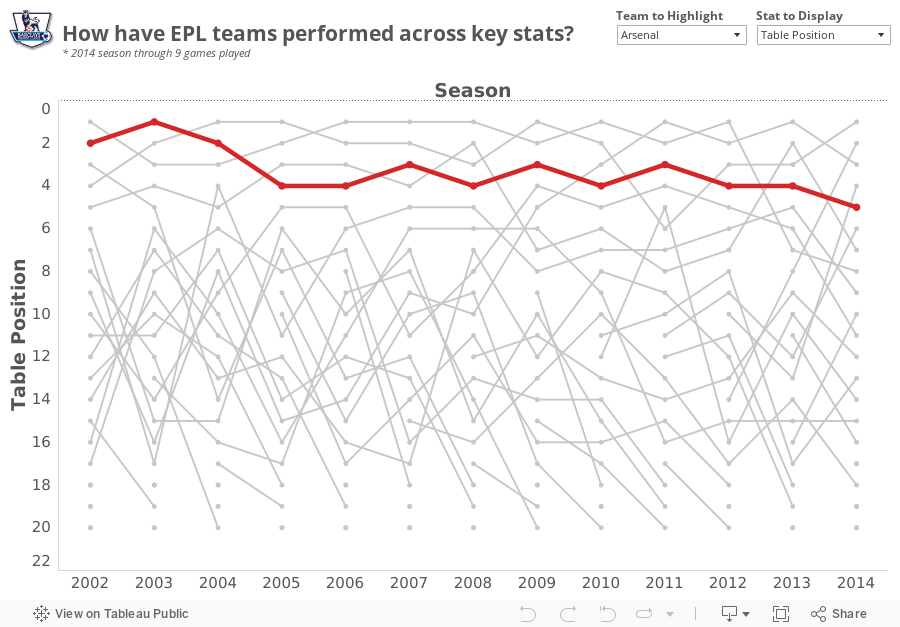
During the webinar, Alex revealed that he was a huge Arsenal fan (as am I), and I wanted to find a simple project to become more familiar with the tool. My basic idea was:

Download the Tableau workbook here.
During the webinar, Alex revealed that he was a huge Arsenal fan (as am I), and I wanted to find a simple project to become more familiar with the tool. My basic idea was:
- Use the import.io Extractor to download the Premier League table from ESPNFC for every season since 2002
- Create a visualization in Tableau
- Allow the people interacting with the viz to highlight their favorite team
- Make Alex happy!
During the webinar, Alex went through a simple Extractor example. Here's a screenshot of the extractor that I built (click on the image to make it larger):
Get the import.io dataset here. Overall, the process was super simple. All I had to do was paste the URL in the box on the left, then add a URL for each season. From there, I clicked on the Download button on the upper right to download it into Excel. I did a bit of cleanup in Excel to make it Tableau-ready. Download the Excel data here.
Before import.io, this would be a painful process of navigating to each webpage, copying the table, pasting it in Excel and repeating for each season. Using import.io, I completed the whole process, including cleaning up the data, in under 5 minutes. The import.io portion of the process took about 2 minutes.
From there, I built this simple viz in Tableau. It took about 30 minutes to build this in Tableau, but I had already sketched out on paper what I wanted to create. I waited until match week 9 completed to publish this viz because I wanted to test how easy it is to refresh the data in the Extractor. It was super simple!
I would highly recommend using import.io. I'm going to continue to look to use it whenever I need to crawl webpages for data.
Download the Tableau workbook here.
Subscribe to:
Post Comments
(
Atom
)


Thank you for sharing wisdom, Andy. Personally, I love import.io, it has been upgraded a lot since last year specially log-in authorization enable. I'm using import.io on few projects, on pricing tag monitoring, Branded public news feeds etc. Has to mention, easy to learn and their tech crew really helpful and dedicated.
ReplyDeleteCheers,
Wendy
Oh man! This was superb for my company. Now we can shoutdown some of our external, expensive web-crawlers and build our own AND manage them as the web-pages changes.
ReplyDeleteHappy, happy day (not for the bureau we bought the existing solution from :) )
Hi Andy,
ReplyDeleteI was visualizing my bump chart with similar data where some dimensions were not available across all years. I was doubting whether bump chart was the way to go until I saw this viz. Your bump chart set the precedent so I feel more comfortable publishing mine at http://vizscapes.blogspot.com/2015/04/top-10-global-risks.html?_sm_au_=iVV3MP1Zqkj3BHDP
Thanks for posting!