November 7, 2016
Makeover Monday: Austin Restaurant Inspections
Austin
,
bins
,
data16
,
Makeover Monday
,
map
,
ratings
,
restaurants
,
TC16
1 comment


As you drill into the viz you get more and more detail, like this:


What works well?
- Super intuitive interface; everyone know how to drill in on a map
- Simple instructions
- Nice grouping of restaurants with a counter
- Nice use of symbols to represent a specific restaurant
- Good use of colors
What could be improved?
- Takes too long to drill in. When I played with it, they could easily show more specific restaurants at once and not shown so many groups.
- I have no idea how many restaurants are good or bad.
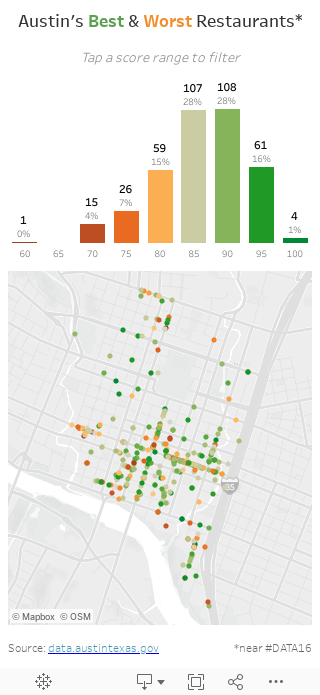
Here's my alternative, designed to be used on a phone. I did that because that would be the likely use case for it. I added a summary of the scores and you can filter down to just those restaurants.
Subscribe to:
Post Comments
(
Atom
)


Phew, good to know I ate at 85+ places whilst I was there :)
ReplyDelete