February 22, 2017
Workout Wednesday: Merimekko Makeover
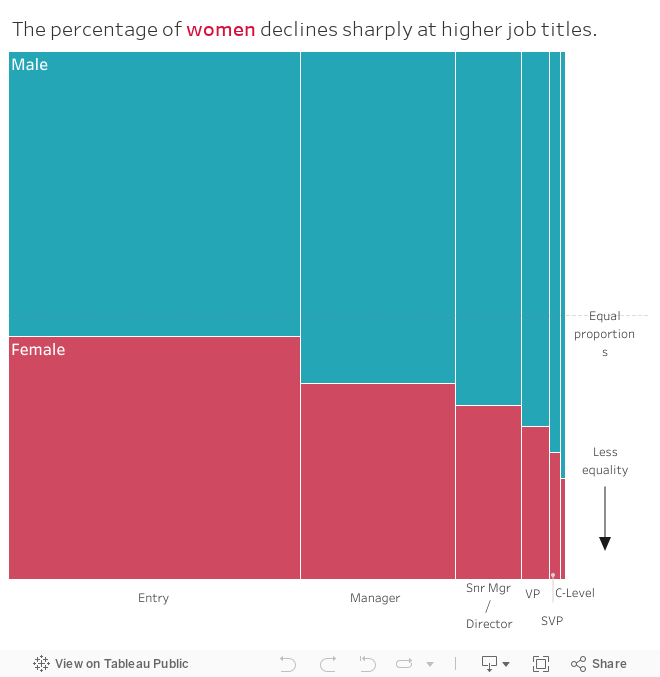
Wow! That this was a tough workout! I've never created a Merimekko chart before and I'm very, very thankful that Emma provided a link to a great how-to blog by Jonathan Drummey.I read through Jonathan's post once and tried to create the Merimekko on my own, but that didn't work out so well. Apparently I was 99% of the way there, however, the order that I placed my dimensions in the view is what tripped me up. I decided to follow Jonathan's blog step-by-step and built a table first like he did to verify the calculations before changing the table into a chart.
This is a good practice in general when working with calculations, especially table calcs and LOD calcs. Build a table to verify the calculations are working as expected, then create your chart. It's much easier to identify problems.
Emma's rules were pretty straight forward:
- Show the 50% point of equality as a grid line
- Set the dashboard size to 660 * 650 pixels
- Add on the direction of less equality
- Label the columns of the Marimekko to match hers
- Label the first two segments Male and Female
- Make sure the tooltips match hers
In the end, I created the entire view in a single sheet. After looking at Emma's I see that she floated some text boxes in the dashboard. I used mark annotations for all of the annotations and used reference lines for the Male/Female labels and for the 50% line (Emma used reference lines too).
Overall, a really good challenge. Took me about 90 min to finish start-to-end.
Subscribe to:
Post Comments
(
Atom
)


No comments
Post a Comment