July 5, 2017
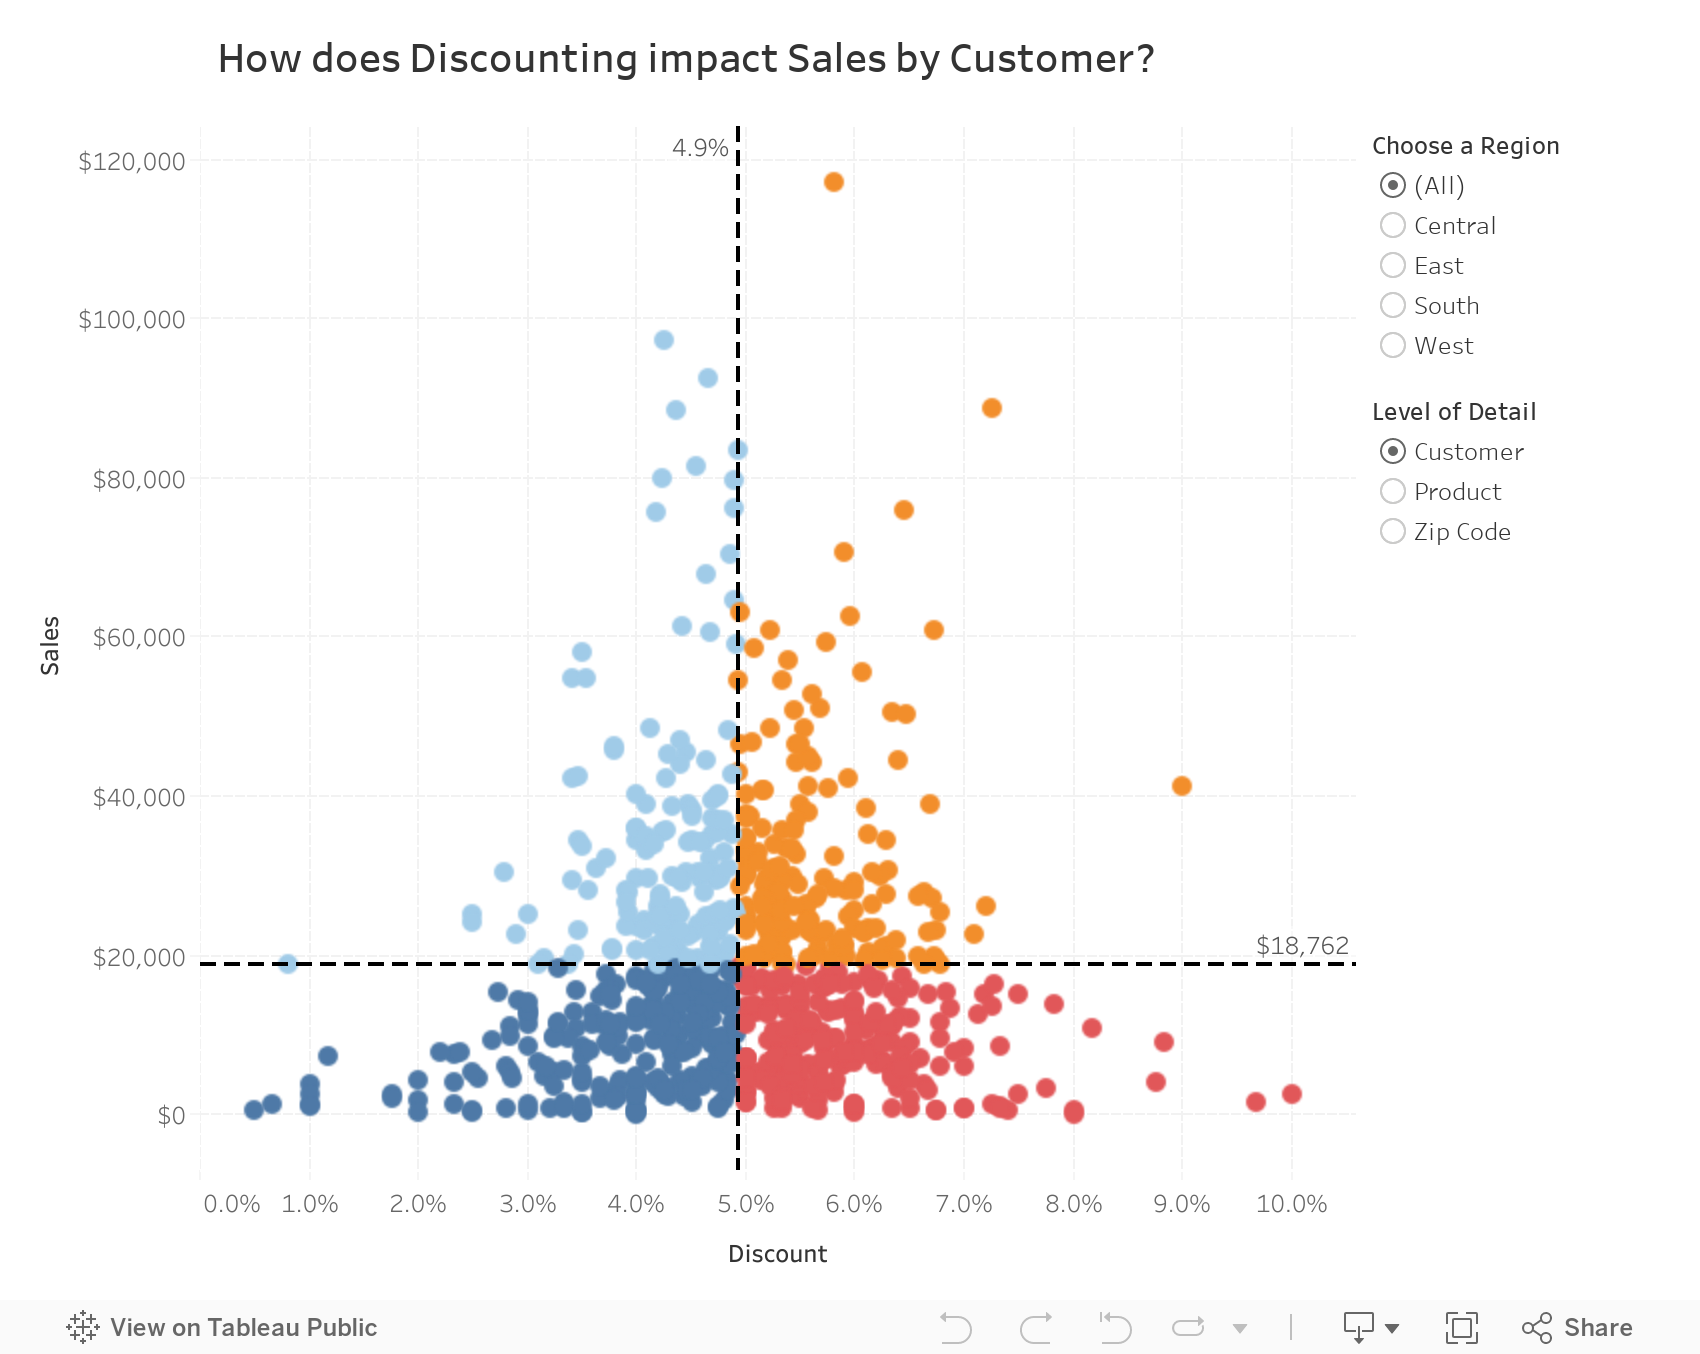
Workout Wednesday: The Quadrant Chart
need help creating a box on worksheet exactly similar to high volume high percentage box in attached image.@VizWizBI @TriMyData @balders93 pic.twitter.com/YdryjNYdf0— Gaurav Arora (@gauravboss1005) July 4, 2017
This week your challenge is to build a quadrant chart, with a few tricks thrown in of course. Download the data here (it's the same version of Superstore Sales I've used for other Workouts).
- Match the tooltips
- Match the title (note that it changes as you change the options on the right)
- Match the colors
- Match the formatting
- Include a Region filter
- Include an option for the user to pick the level of detail in the view
- Include lines to aid in breaking up the quadrants
Good luck!
Subscribe to:
Post Comments
(
Atom
)


Used leaarning from Work out Wednesday week2 by Emma for Dynamic Sheet Name.
ReplyDeleteStill not able to figure out how to get Quadrant names in coloured in tooltip
Link : https://public.tableau.com/profile/singhrahul#!/vizhome/Week27WorkoutWednesday/Dashboard1?publish=yes
https://public.tableau.com/profile/pavan.h.m#!/vizhome/Quadrant-Chart/QuadrantAnalysis?publish=yes
ReplyDeleteI think it works: https://public.tableau.com/profile/in.s.de.castro#!/vizhome/week27-TheQuadrantChart/HowdoesDiscountingimpactSalesby
ReplyDeleteNot quite! Your title isn't dynamic when I pick a Region. You also have spelling mistakes in your tooltip.
DeleteThanks a lot, I think now I have it :)
Deletehttps://public.tableau.com/profile/in.s.de.castro#!/vizhome/week27-TheQuadrantChart/HowdoesDiscountingimpactSalesby
Could you make a video on how to change the tool tip color or the logic to get that done?
DeletePavan, my workbook is available for download. See how I did it. You'll learn more if you try to figure it out yourself.
Deleteyup, Got it . Thanks Andy. Made use of the tip -http://public.tableau.com/views/PercentofTotalofTopNOnly/Title?:embed=y&:loadOrderID=0&:display_count=yes&:showTabs=y?:embed%3Dy to retain the % of total . But my Measure(OIT) has same value for different products. what tableau is doing ,it is gruping the ranks with the same measure value. How do i get individual ranks with same measure value?
DeleteHad to make a change. Try this:
ReplyDeletehttps://public.tableau.com/profile/tony.boyd4183#!/vizhome/QuadrantChart_6/Dashboard1
I gave it go and here is my viz. Thank you for a great workout!
ReplyDeletehttps://public.tableau.com/profile/asmita.sonawale#!/vizhome/TheQuadrantchart/QuadrantChart