December 17, 2018
Makeover Monday: London Bus Safety Performance
bus
,
KPI
,
Makeover Monday
,
performance
,
safety
,
TfL
,
transport for london
No comments

So, to get back at them, I gathered all of the bus injury data from Transport for London and gave it to all of you, the Makeover Monday Community, to help make their scorecards better. What does the scorecard look like now?
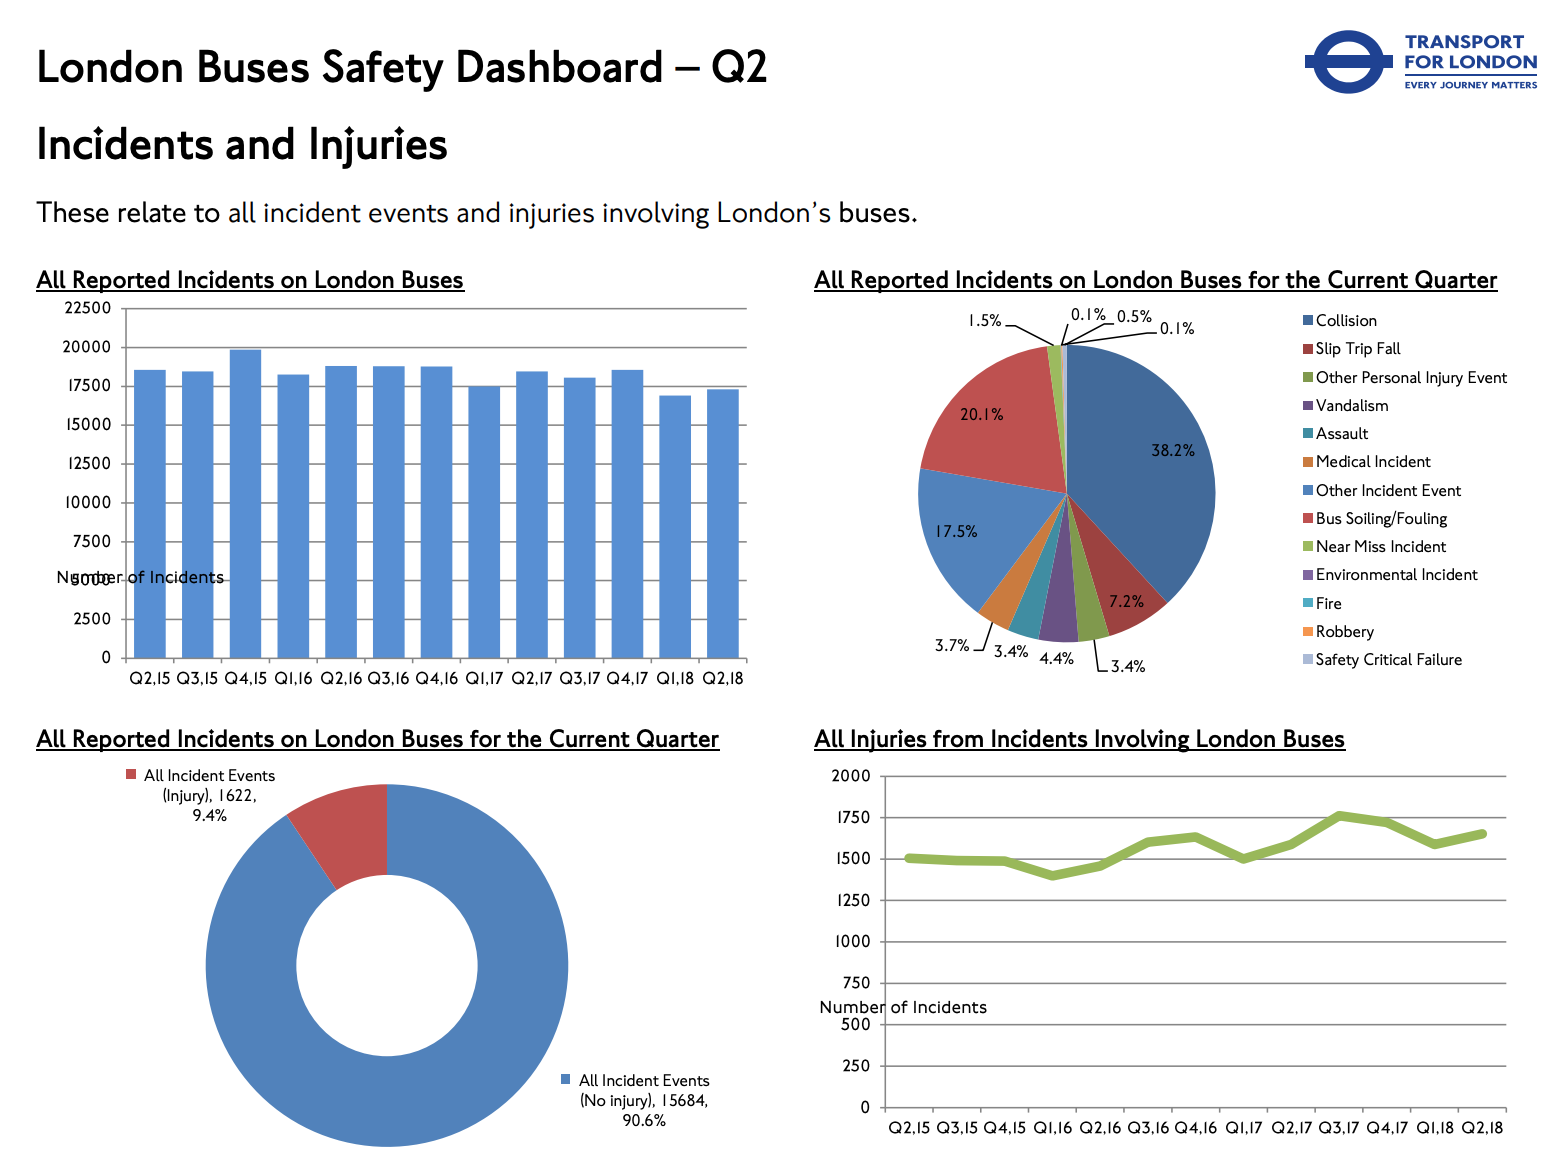
What works well?
- The line charts are easy to understand.
- All charts have good titles.
- The donut chart is clear and simple.
- The colors work well together (except the pie).
What could be improved?
- The pie chart could be made into a bar chart.
- The charts could use more context.
- The data is horribly delayed (it's December 17th as I write this and the data only goes through June).
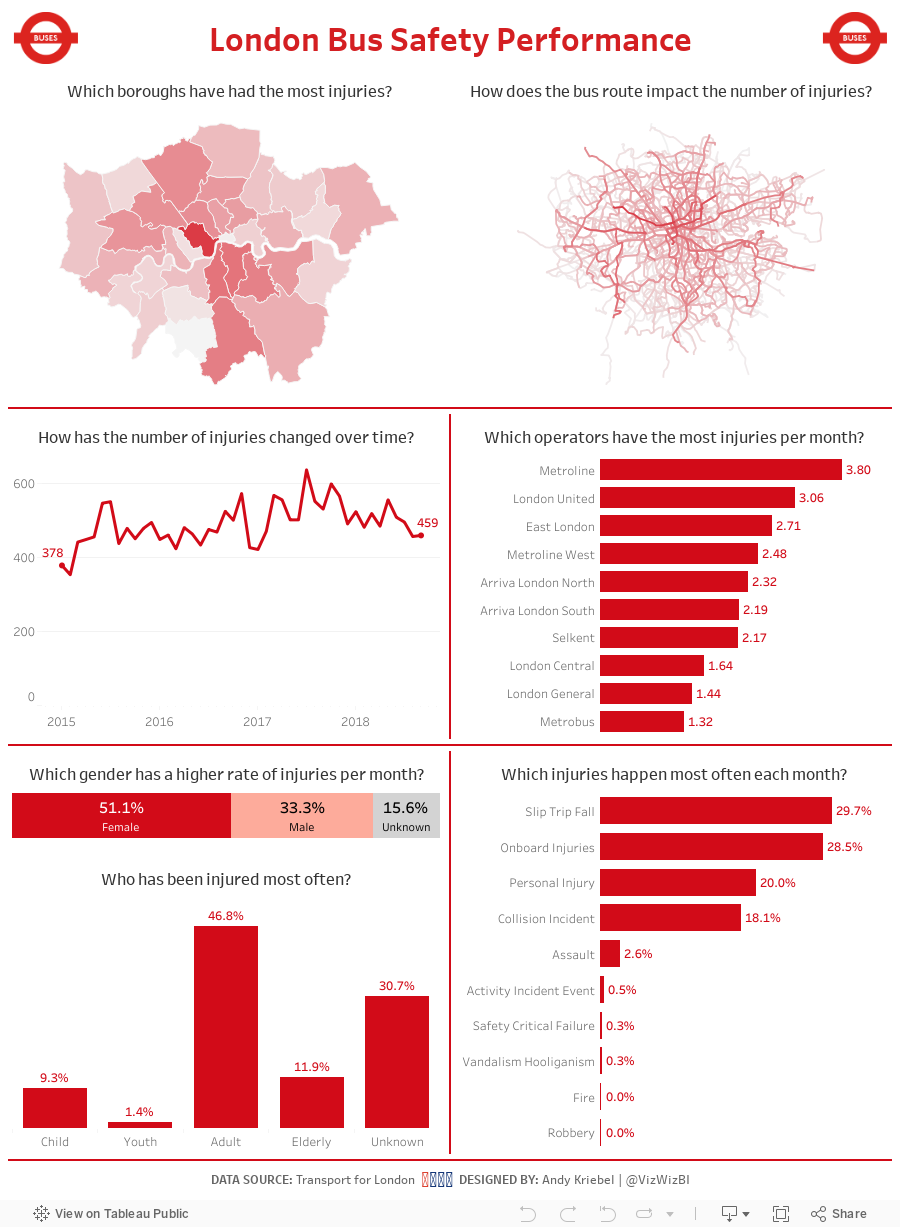
What I did
- Give the user an opportunity to explore the data; every chart has action filters
- Use TfL colors
- Provide context on some of the charts, like injuries per month
With that, here's my Makeover Monday week 51.
Subscribe to:
Post Comments
(
Atom
)


No comments
Post a Comment