February 3, 2019
Makeover Monday: How Chinese New Year Compares With Thanksgiving


What works well?
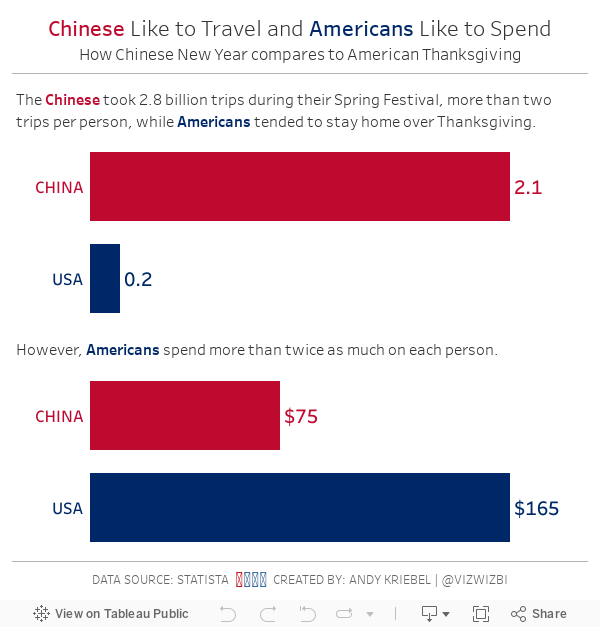
- Good title and subtitle
- Using colors that are easy to distinguish from each other
- Including the numbers to give the circles context
What could be improved?
- Comparing circles is very difficult; what are we to compare? The size? The diameter? Either way, it's very difficult.
- Remove the background image
- Make the numbers comparable. China's population with way bigger than the US. Converting them to per capita would make for better comparisons.
What did I do
- Transposed the data so that I had a column for each measure
- Create per capita calculations for each measure
- The trips and spending data looked like the most interesting, do I discarded the viewership data since that really has nothing to do with the other data.
- Changed the circles to simple bar charts
- Made the titles of the charts state the message of the chart
Subscribe to:
Post Comments
(
Atom
)


No comments
Post a Comment