February 22, 2019
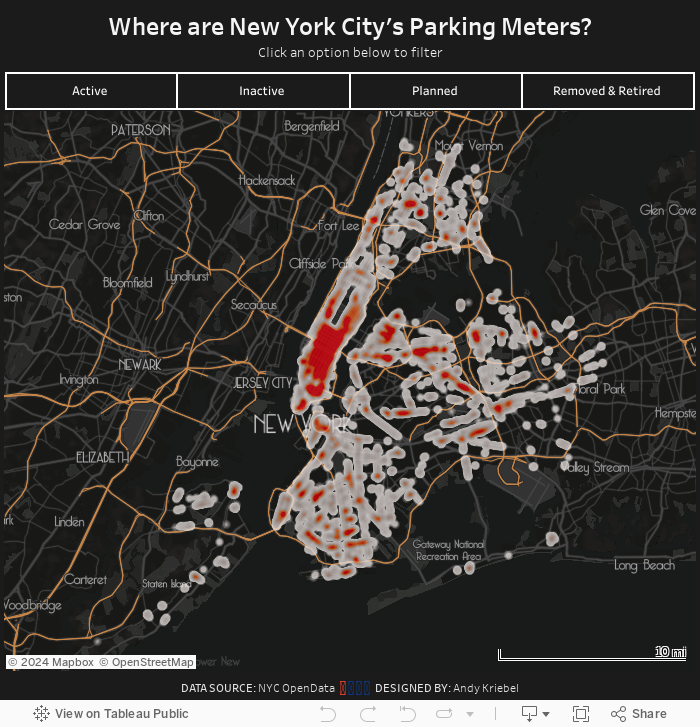
Where are New York's Parking Meters?
density
,
map
,
Mapbox
,
new york city
,
open data
,
parking
No comments

Their map is impossible to read with some many big dots overlapping each other. This also makes it hard to see the concentration of parking meters. My assumption going in was that you'd see way more in Manhattan.
All I really did was create a map, plot each point, and change the mark type to Density. From there it was formatting:
- Using a custom mapbox map, which I customized based on the mapbox template Metropolis.
- Play around with lots of colors, then intensity and opacity of each of those colors, before settling on a choice.
I probably could have done this process for days and days without ever finding a "perfect" solution for the formatting, so I decided it's good enough and wanted to get it published. Enjoy!
Subscribe to:
Post Comments
(
Atom
)


No comments
Post a Comment