March 8, 2017
Workout Wednesday: UK House Prices Hexbin Maps
hex map
,
hexagon
,
hexbin
,
housing
,
map
,
united kingdom
,
Workout Wednesday
No comments
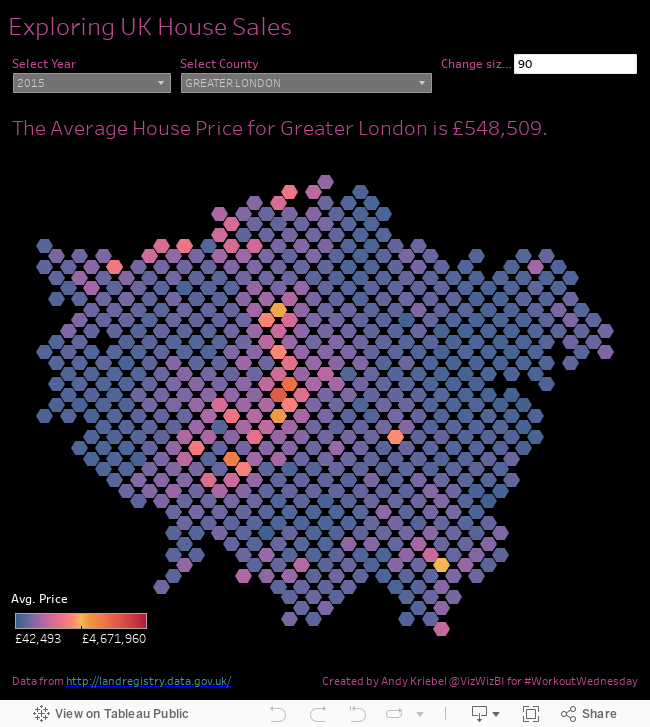
Let's start with Emma's requirements:
- Create the hexbin map based on the District
- Change the size of the hexagon using a parameter
- Match the sunrise-sunset diverging colour palette on the hexagons
- Match the tooltips and titles
- Set the dashboard size to 650 * 700 pixels
Fortunately Emma linked to a blog post by Matt Chambers for how to use the HEXBINX and HEXBINY functions. This made the exercise immensely easier because all I really needed to do was swap out [Ratio] in the blog post with my parameter.
I couldn't get the total in my title to match, though I knew I had done it right. It turns out Emma used an LOD that returns the average for both years, not just the year selected. I decided to use the year selected because that reflects what's in the map. I also create this value with a table calc since all of the dimensions I needed were already in the view.
Also, requirement #2 to change the size is actually a requirement to change the denstiy, i.e., how many hexabins are created. So, I decided to also size the hexagons based on how many are displayed in the view. So if you enter a smaller number, the hexagons are bigger. Enter a big number and the hexagons are smaller. I also limited the parameter to between 20-200.
Lastly, I floated everything since the color legend had to be floated above the hexmap. I find that Tableau works best when you go either 100% float or 100% tiled.
Lastly, I floated everything since the color legend had to be floated above the hexmap. I find that Tableau works best when you go either 100% float or 100% tiled.
Nice fun challenge! Learned a bunch!
Subscribe to:
Post Comments
(
Atom
)


No comments
Post a Comment