July 9, 2018
Makeover Monday: Have volcanoes nearest to a tectonic plate erupted more recently?
Alteryx
,
distance
,
eruption
,
geology
,
Makeover Monday
,
tectonic plates
,
volcano
,
workflow
No comments


What works well?
- Including a description for how to interpret the chart
- Ordering the volcanoes from front to back according to elevation above sea level
- Coloring by the number of eruptions since 1893
- Excellent tooltips
What could be improved?
- Where is sea level? Some of the volcanoes are below sea level. You can't really size by negative feet below sea level.
- There's no explanation for why some of the volcanoes have labels.
- Make it more clear where the based of the volcano starts. I assume it's at the bottom of the viz.
- Include reasoning for why 1893 is when the counting of the eruptions starts.
What I did
I started by creating an Alteryx workflow that took the volcanic eruptions data and plotted the volcanoes onto a 250 miles grid of the world.


I had to start all over, so this time I decided to look at how far each volcano was from the boundary of the nearest tectonic plate. Again, Alteryx to the rescue!

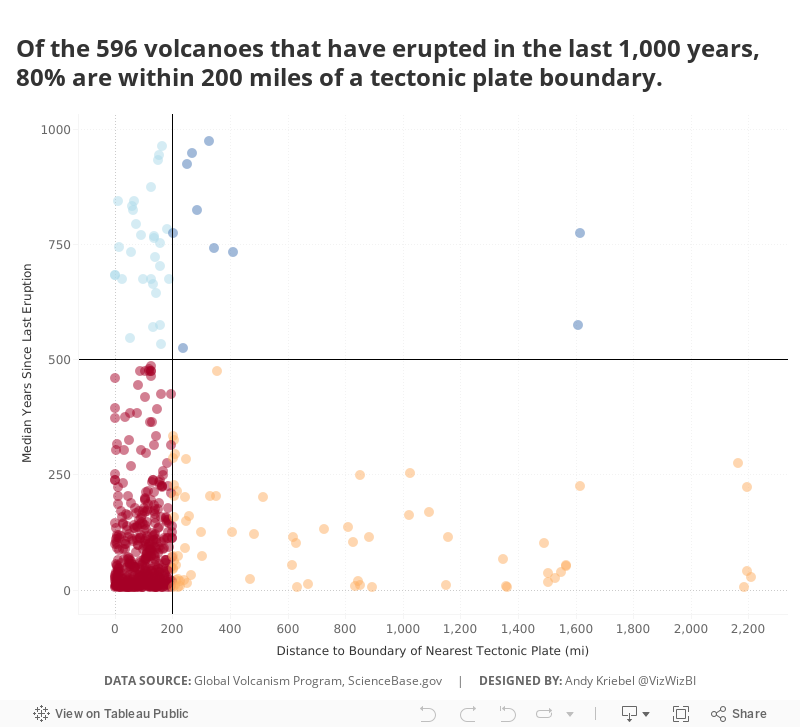
Once I had the data I needed, I created a few calculation to help me create a simple quadrant chart that clearly show that the nearer a volcano is to a boundary of a tectonic plate, the more recently it erupted. All of that totally makes sense given what we learned about geology in school.
Subscribe to:
Post Comments
(
Atom
)


No comments
Post a Comment