June 9, 2019
#WorkoutWednesday Week 20: Top and Bottom States for Total Orders
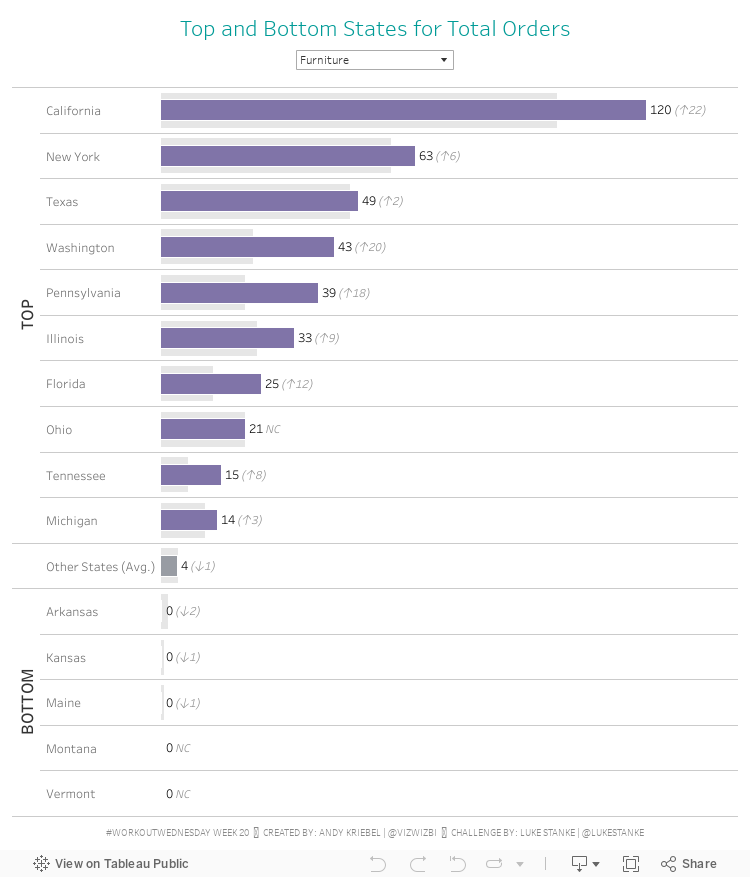
As I continue catching up on WW, I went to week 20, which was a live event at the SFTUG, so I knew it had to be solvable quickly and wouldn't require any crazy calcs. The goal was to create a view that:- Groups together the top 10 States, bottom 5 States and all other States based on their total orders.
- Shows all other States as an average number of orders across the States
- Display the 2018 value plus the change vs. 2017 on the end of the bar with arrow indicators for the change
- Show different colored bars for 2018 depending on the groups created in step 1 above
I thought for sure this was solvable with table calcs and it mostly is, until you get to all other States. You would need State in detail and this draws multiple bars and the calcs for 2018 and 2017 orders would need quite a bit of thinking to get them just right. I decided on LODs instead.
If you haven't solved this one yet, I highlight suggest you consider sets for the Top, Bottom and Blank groupings.
Here's my solution:

Subscribe to:
Post Comments
(
Atom
)


No comments
Post a Comment