June 17, 2019
#MakeoverMonday: Finding the right Airbnb for you in Berlin
airbnb
,
Alteryx
,
BAN
,
big numbers
,
locations
,
Makeover Monday
,
map
,
polygon
,
reviews
,
spatial join
,
stats
No comments


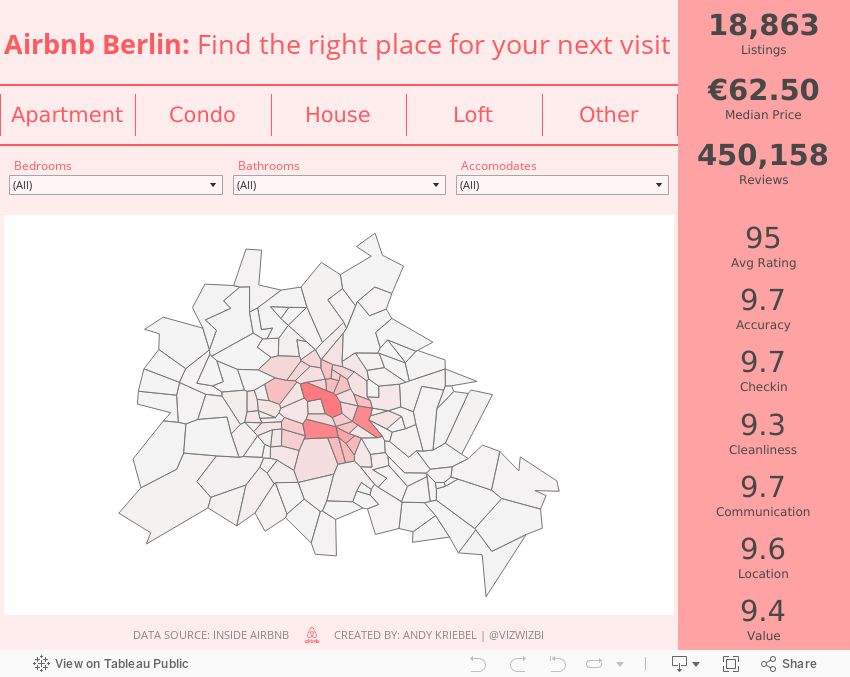
What works well?
- Since the data is about finding a place to stay, a map is super intuitive for the user.
- The map helps show concentrations of Airbnbs.
- The summary stats on the right help add context.
- There are some good filtering options.
What could be improved?
- The red/green color palette won't work for the colorblind.
- The red/green palette makes me think of bad vs. good, but they're actually for categorical data.
- It's harder than necessary to find information about specific rentals.
What I did
I joined the spatial file to the listings and reviews data in Alteryx. I joined the data to get some summary data that I needed for my viz. I then smoothed out the edges of the neighbourhoods to make the map less jagged.
From there, I thought about the data from the user's perspective. What would I want to know about properties and how would I find that information? That served as the basis for this exploratory viz.
Subscribe to:
Post Comments
(
Atom
)


No comments
Post a Comment